Procon Guide
PROCON II is a software for the
technical controlling of mechanized tunnel drives. A
professional management system for the efficient recording,
analysis and visualization of data. The foundation for your
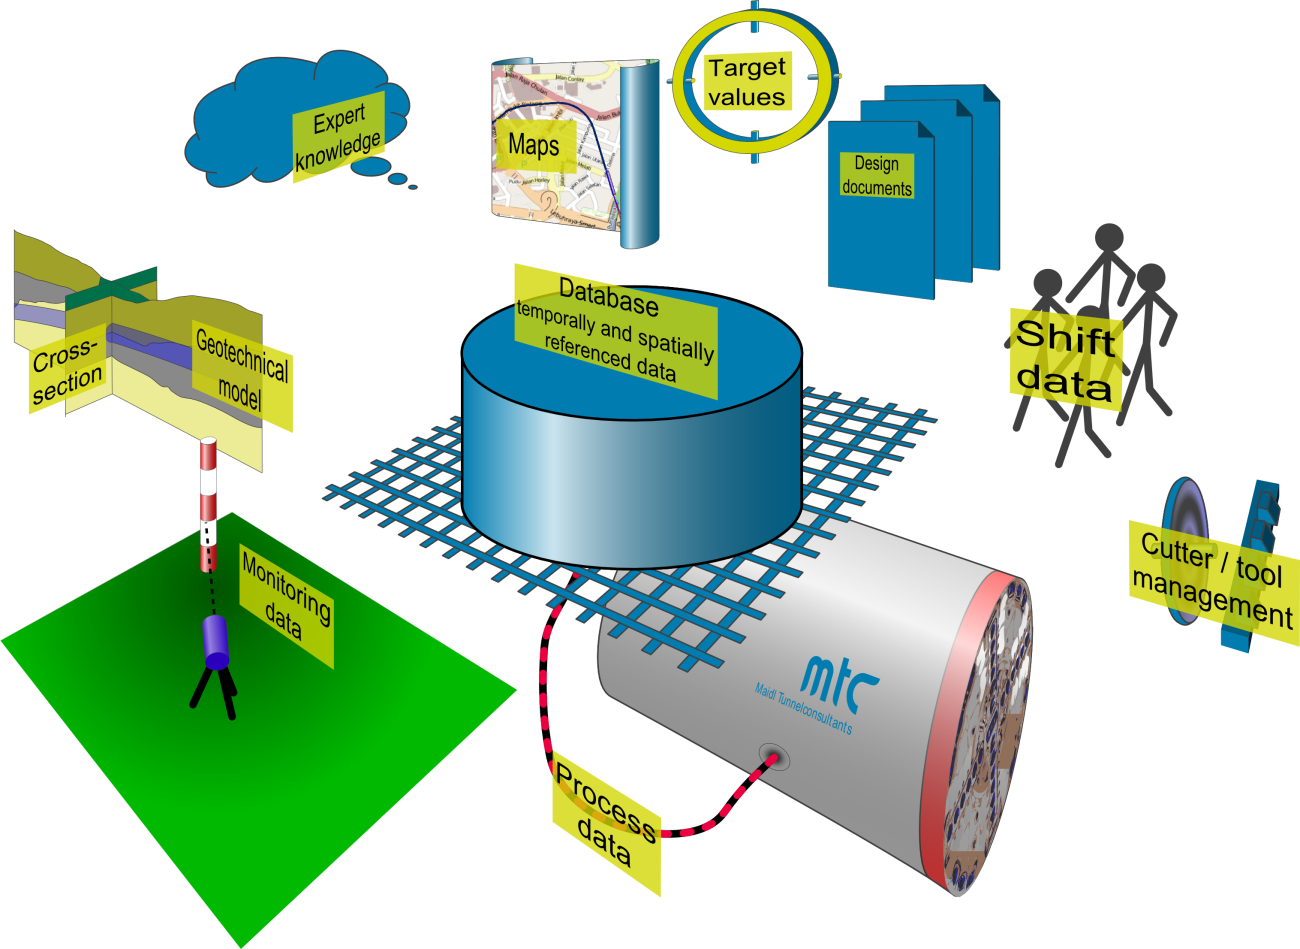
knowledge management in mechanized tunneling projects. It aims to
visualize time-dependent, location-dependent and object-dependent
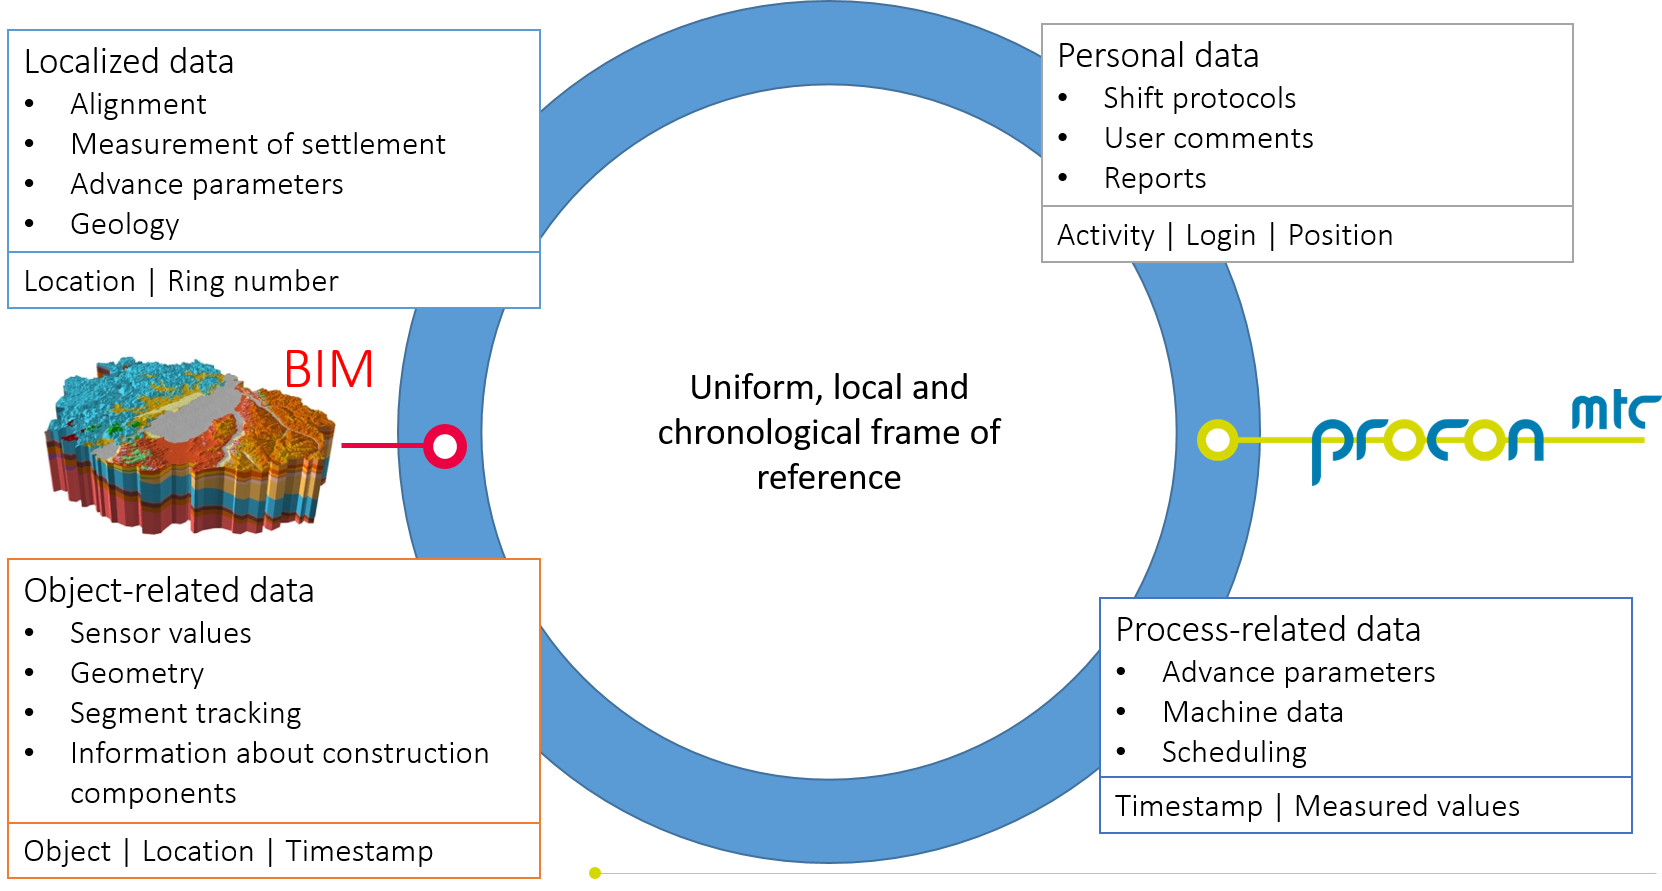
data in an intuitive and meaningful way. The figure below shows
the various sources of data and information that can be
integrated, visualized and analyzed in PROCON II.
PROCON II is based on the latest
software technology. Thus, your vast process data are
transformed into visual information. Take advantage of the
affordable possibilities of geographical information systems
(GIS) and link them to your interactive charts. With the generic
chart and dashboard configurator, you can visualize all of the
relevant information tailored to your specific needs and follow
your project live with your web browser.
PROCON II is a web application that is hosted on a
secure and highly availabile cloud system. On the client side,
access to PROCON II is managed by means of SSL encrypted
communication via the HTTPS protocol and an additional access
control layer using personal logins per user. Beside the
installation of a client certificate for the encrypted
communication, no further installation efforts are required on
the client's computer. A special version with an optimized
visualization for mobile devices is optionally available.
The modular design of the software allows to freely configure
the system according to the specific requirements of each
project. Beside the visualization of both real-time and
historical machine data, further information and data can be
integrated to PROCON II. Target values from the design process
can be directly compared to actual measurements. The manifold of
different visualization options can be conveniently arranged on
dashboards and can also be used to create printed reports.
Limit and alarm values are also stored in the system and can be
configured for an automatic alarm messaging in case of breaking
their thresholds.
In addition to sensor values, also
calculated and aggregated values (minima, maxima, averages,
cumulated values, etc.) can be defined used for further analyses
and visualizations. Thus, for example, interactions between
different parameters can be identified and investigated.
Furthermore, it is possible to adapt the database to changes in
the data acquisition that occurs in a later stage of the project
using these customized calculation values without corrupting the
original data.
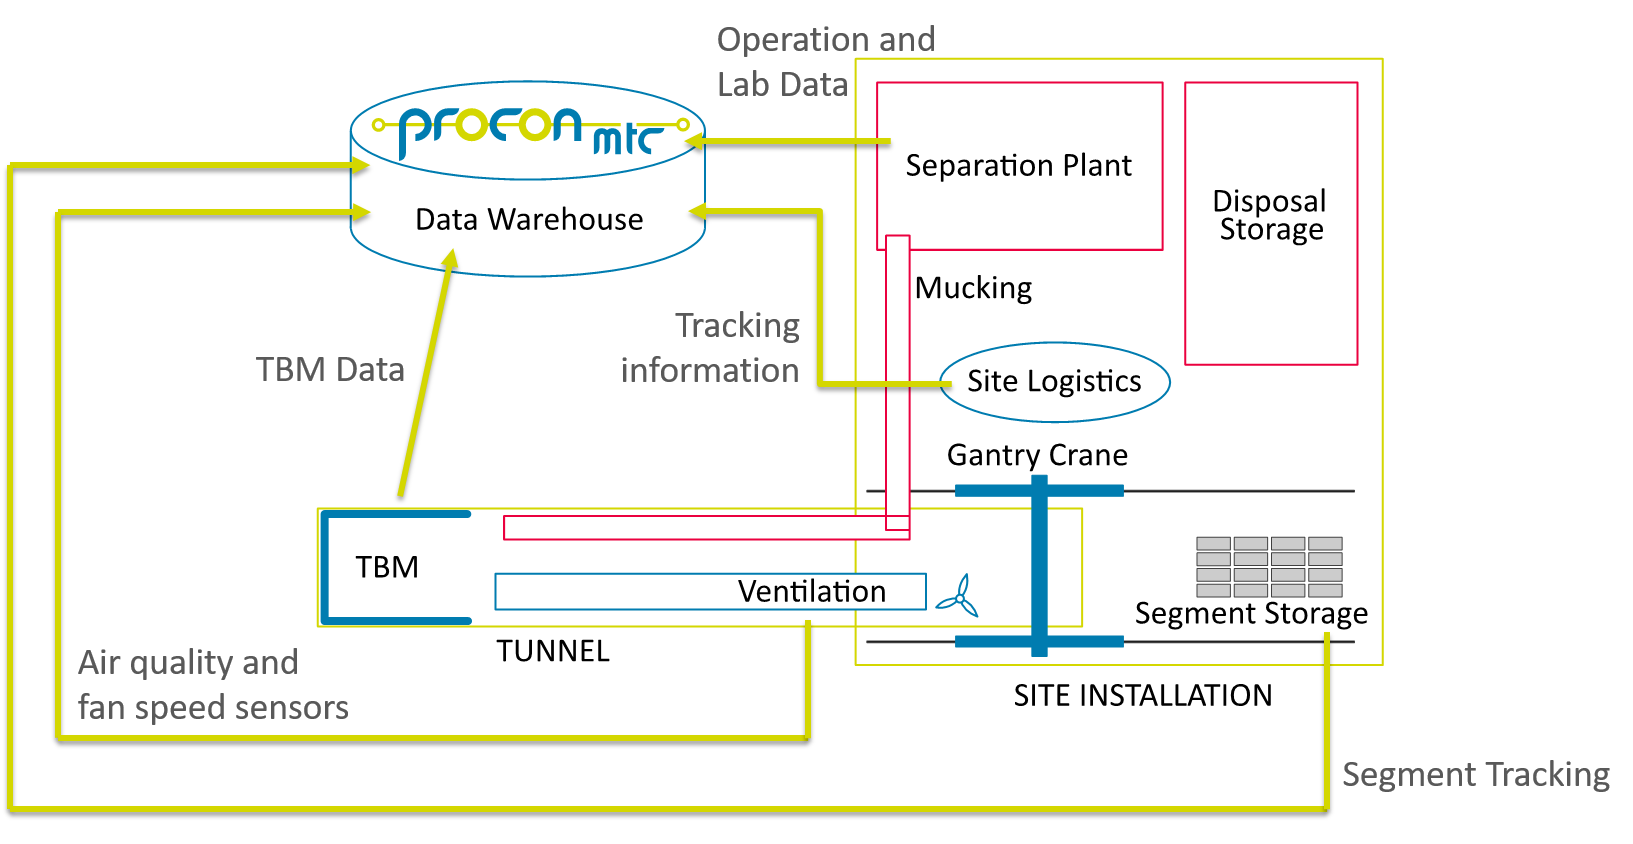
In addition to the various fields of
application of TBM data, PROCON can also integrate data from
various other data sources related to the tunneling project.
This can include data from the geo monitoring, the separation
plant or the ventilation system. All of this external data can
be assembled on PROCON dashboards along with critical TBM data
to get a holistic overview of the tunneling project.
The secured data hosting in a cloud
service computing centre ensures sustainable and secure
archiving of both automatically acquired and manually entered
data. The installation of special hardware on site is not
required. For full usability it is sufficient to set up a
reliable internet connection for the transfer of machine and
monitoring data from site to the PROCON II host.
In the following we invite you to an interactive
introduction tour to PROCON. In this process, the individual
features of PROCON are generally described and assigned to a link
to the software where you directly can test the introduced
features on your own.
Dashboards
All data from the PROCON II data warehouse can be visualized by
means of interactive and customizable charts. These charts can be
directly zoomed, adjusted and arranged on specially developed
dashboards in the browser. These dashboards gather information of
specific topics and are used to display several sources of data
in a common reference system for immediate comparability. In this
context, your data is linked on dashboards with maps of a
geographic information system as well as a digital ground models
in a location or time reference system.
Each chart is
capable of displaying an arbitrary selection of machine data,
target values, additional information and calculated values in a
customizable visual appearance. For this purpose, line charts,
column charts and area charts are available. For suitable data
sources, also pie charts can be employed.
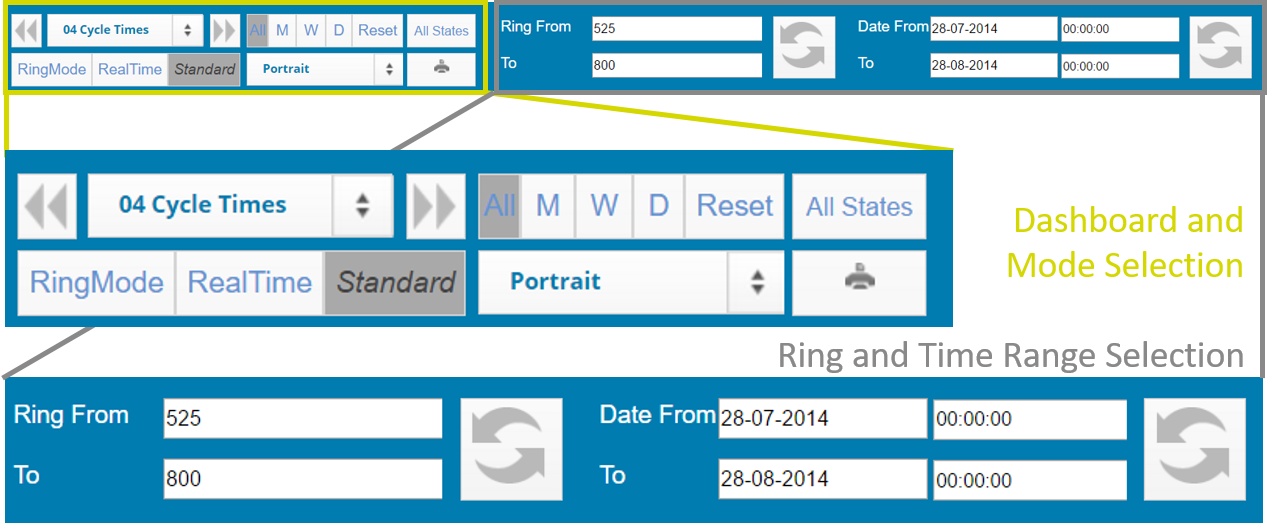 |
Dashboard navigationThe range of the data to be shown in the dashboard can be easily and intuitively selected by either scrolling or zooming in the charts or by picking a time or ring range in the top menu. Additionally, the last day, week or month can be selected by clicking the respective button. After the selection of the respective range you can easily change the current dashboard using the drop down menu or the navigation arrows in the top left corner of the dasboard menu. This significantly simplifies the data analysis. A unique feature of Procon is that the all data of all types is accessible. With am incredible high performance you can zoom, for example, average values from days to 10 seconds raw data. |
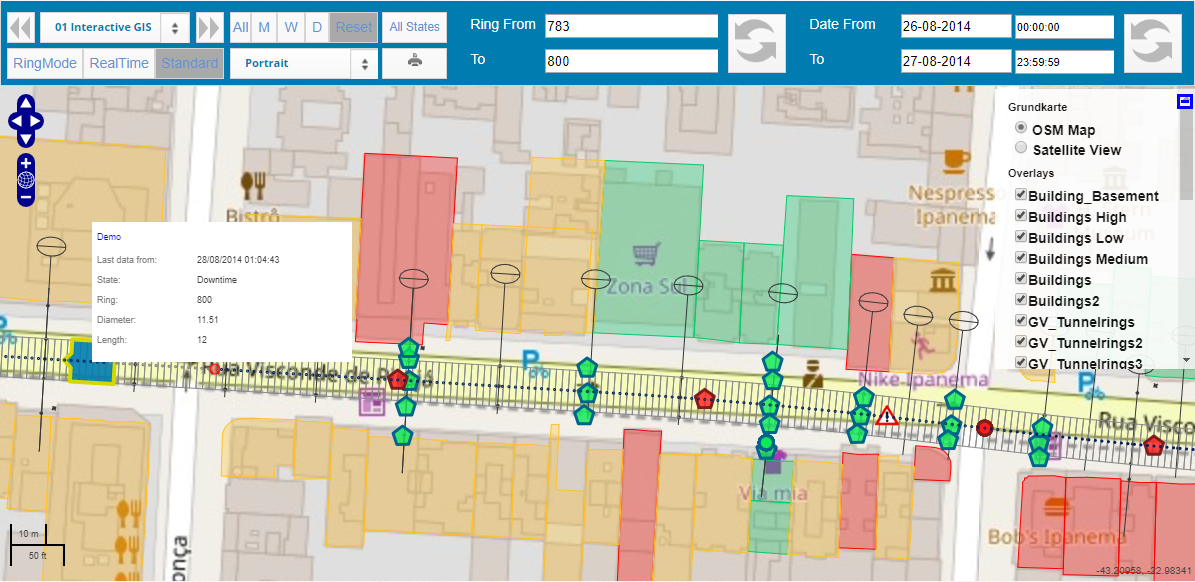
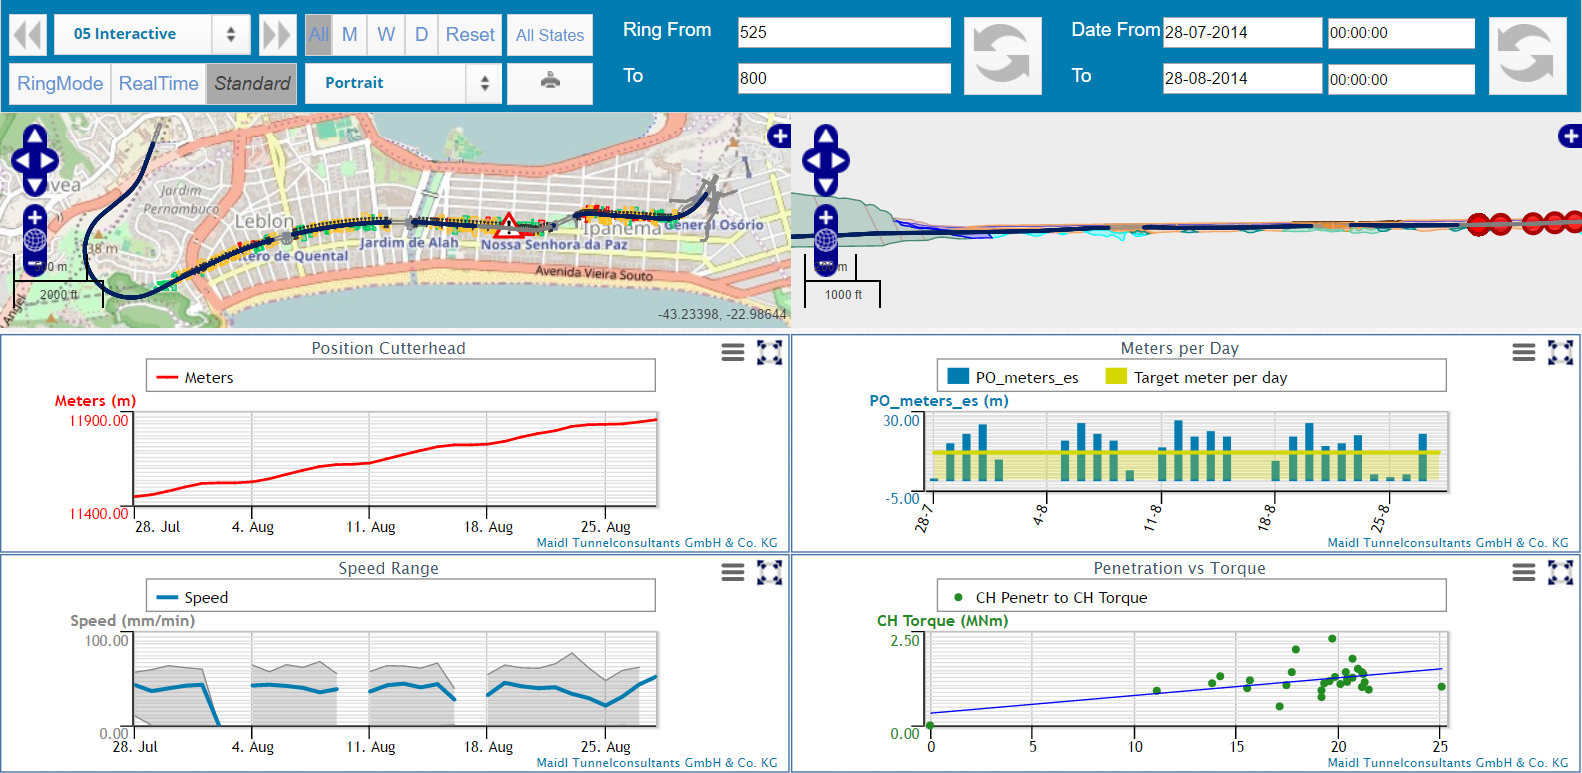
Interactive GISAll relevant project documents as CAD drawings, reports on existing infrastructure or buildings in the vicinity of the tunnel, geotechnical reports, ground parameters or images can be stored in the data warehouse and attached to the project-wide geometrical and temporal reference system. Using a geodetic information system (GIS) the relation of these metadata with the automatically acquired machine data and all further available project information is displayed on an interactive map of the tunnel and its environment. Project relevant documents and drawings can be visualized on different layers. To see the individual layers, click the "+" Button at the top right corner of the map to open the drop-down menu. For better orientation, the alignment and the current position of the tunnel boring machine are marked in the map as well. It is also possible to display multiple alignments and TBM position on the same map. Thus, all potential hazards, alert conditions, data and performance analyses and further visualizations can be directly referred to the respective location of the machine and the event. 
|
 |
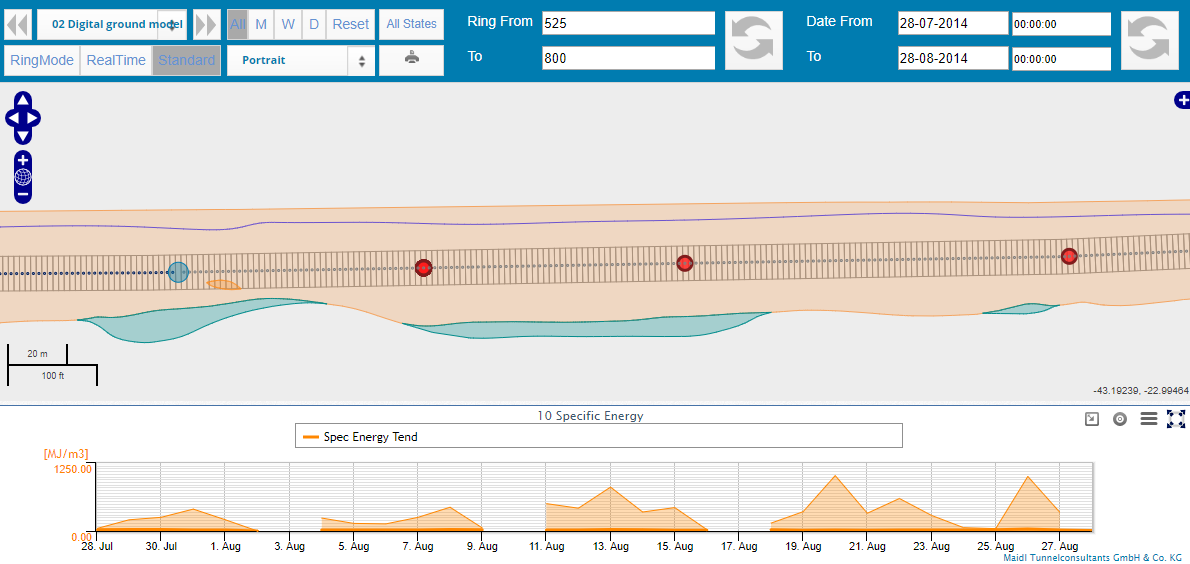 |
Ground modelAn optional geo-referred ground model can be stored in the PROCON II data warehouse as well. This model comprises not only the geometrical definition of geotechnical layers in the longitudinal section along the tunnel alignment but also the respective ground parameters like strength or abrasivity. Thus, the ground model serves as a reference for wear, consumption and performance analyses. The interactions of the TBM with the ground are continuously tracked by means of machine data analysis. The current ring is highlighted by a blue circle. Comparing target and actual values of the ground support, also settlements and the stability of the tunnel face can be monitored in real time. In an interactive visualization of the longitudinal section, the ground model can be further displayed along with arbitrary data visualization charts on a dashboard.
|
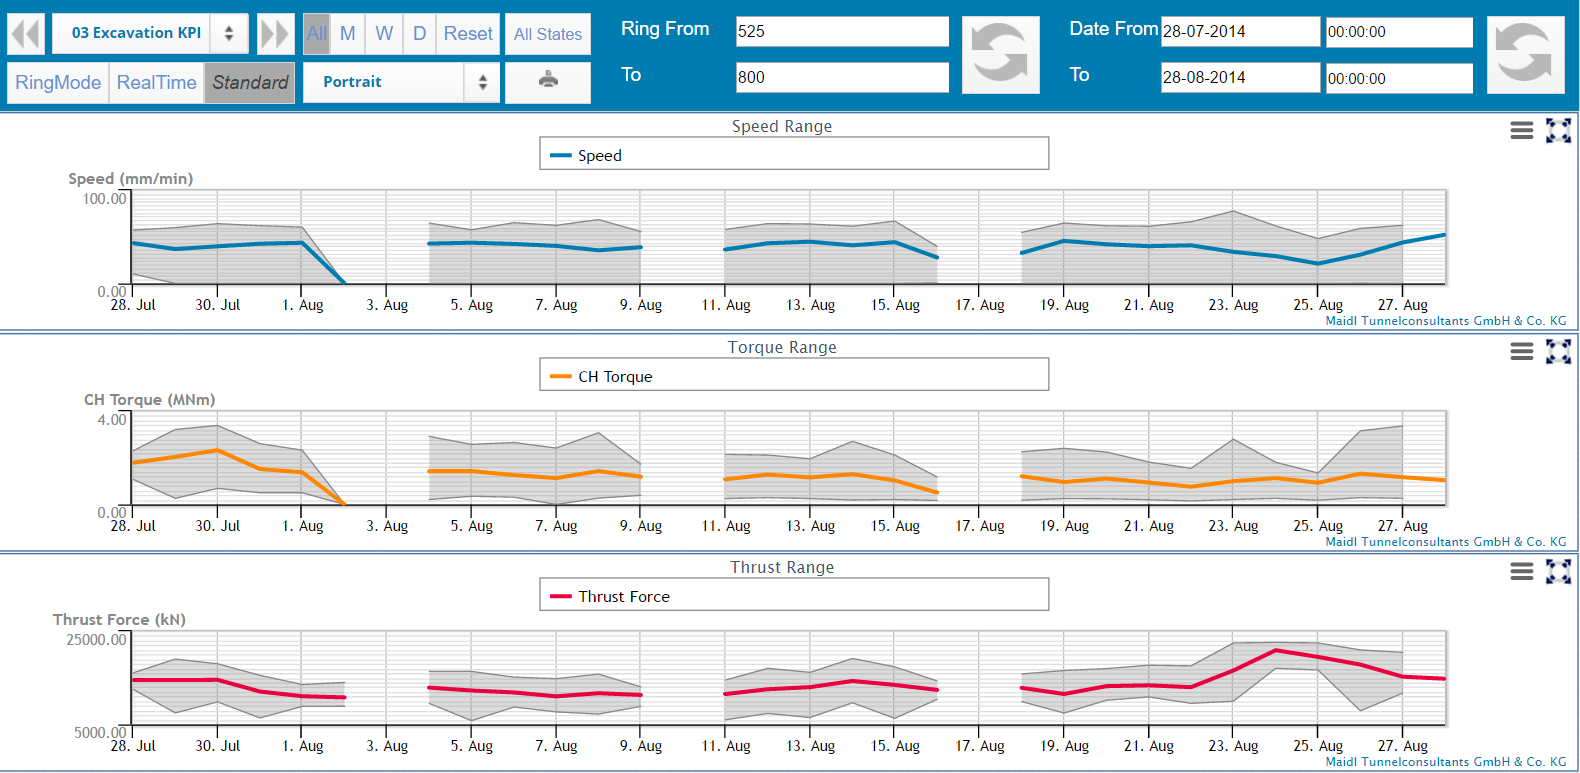
Excavation KPI RangesAll machine parameters and other time- and location-dependent data can be visualized in single charts that can be positioned on the dashboard at will. Thus, you will always have the overview of the current status and developement of the project.
|
 |
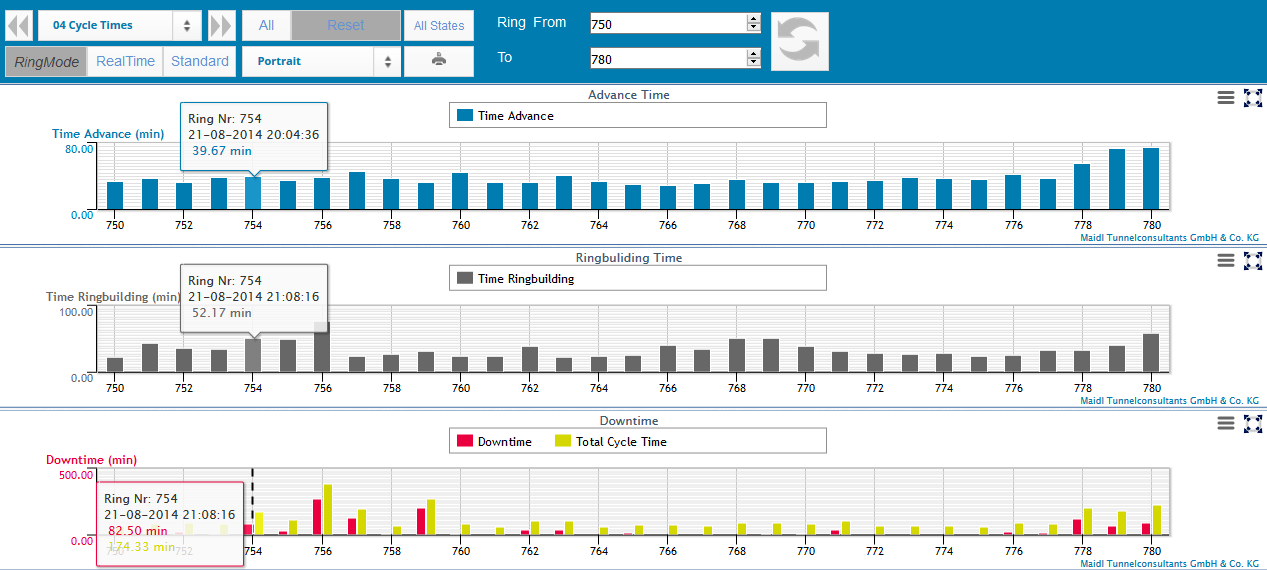 |
Cycle timesOf course, also production data of different processes can be arranged in individual dashboards.
|
Interactive DashboardIn PROCON II, users can generate individual, interactive dashboards for their specific needs. They can combine maps, geological models, charts of different types and individually designed reports. For all elements of the configured dashboard, data with the same time range are injected such that they can be compared comprehensively.
|
 |
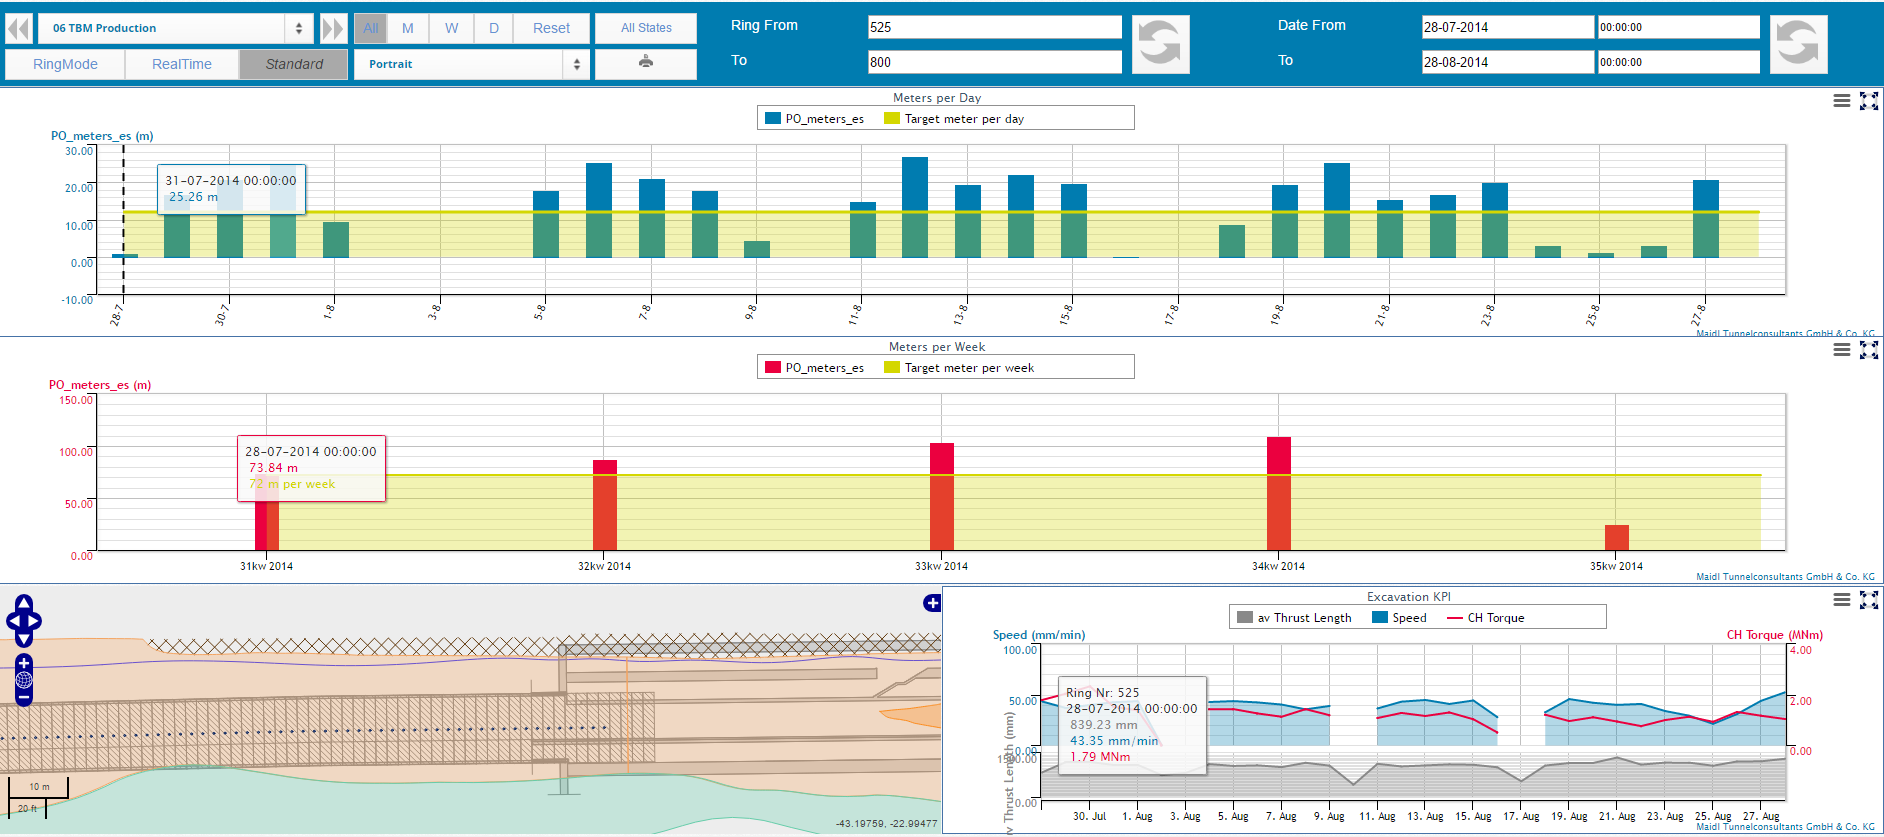 |
TBM productionThe performance of the TBM for each calendar day or week can be combined with maps or charts of machine parameters.
|
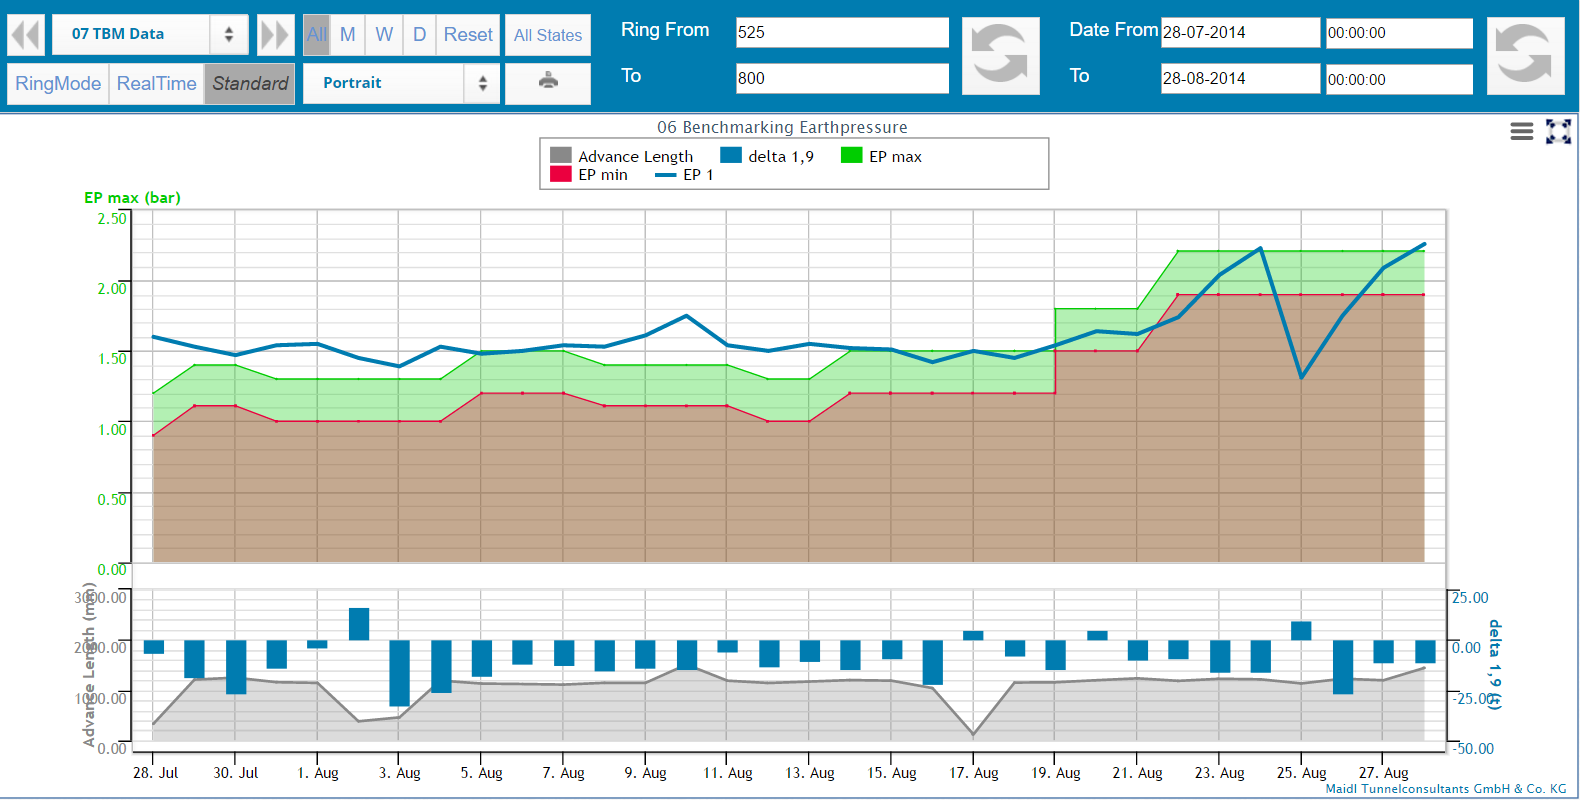
TBM Data BenchmarkingFor each advance parameter, target values or desired ranges can be defined. Additionally, analytical computations can be performed using the formula editor. This enables a target/actual comparison on all levels. In the presented example, the earth pressure developement is shown in comparison to the target values of the support pressure calculation. In the bottom of the dashboard, the fluctuation of excavation volume in relation to the thrust jack extension is presented.
|
 |
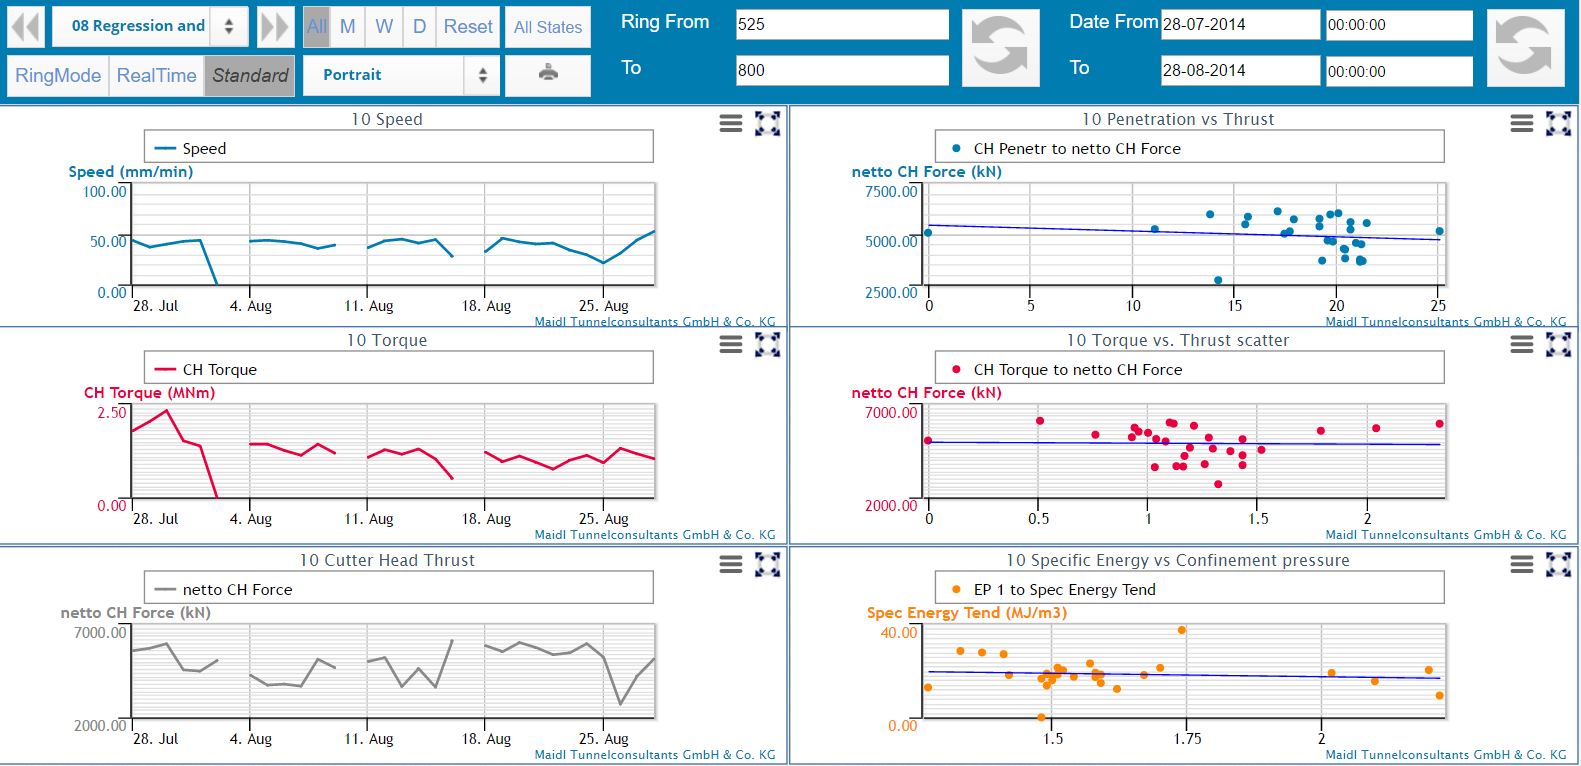 |
TBM Data Regression ChartsBy means of regression charts, correlations between parameters can be detected. Thus, changes of ground conditions or effects of steering decisions can be easily tracked and evaluated.
|
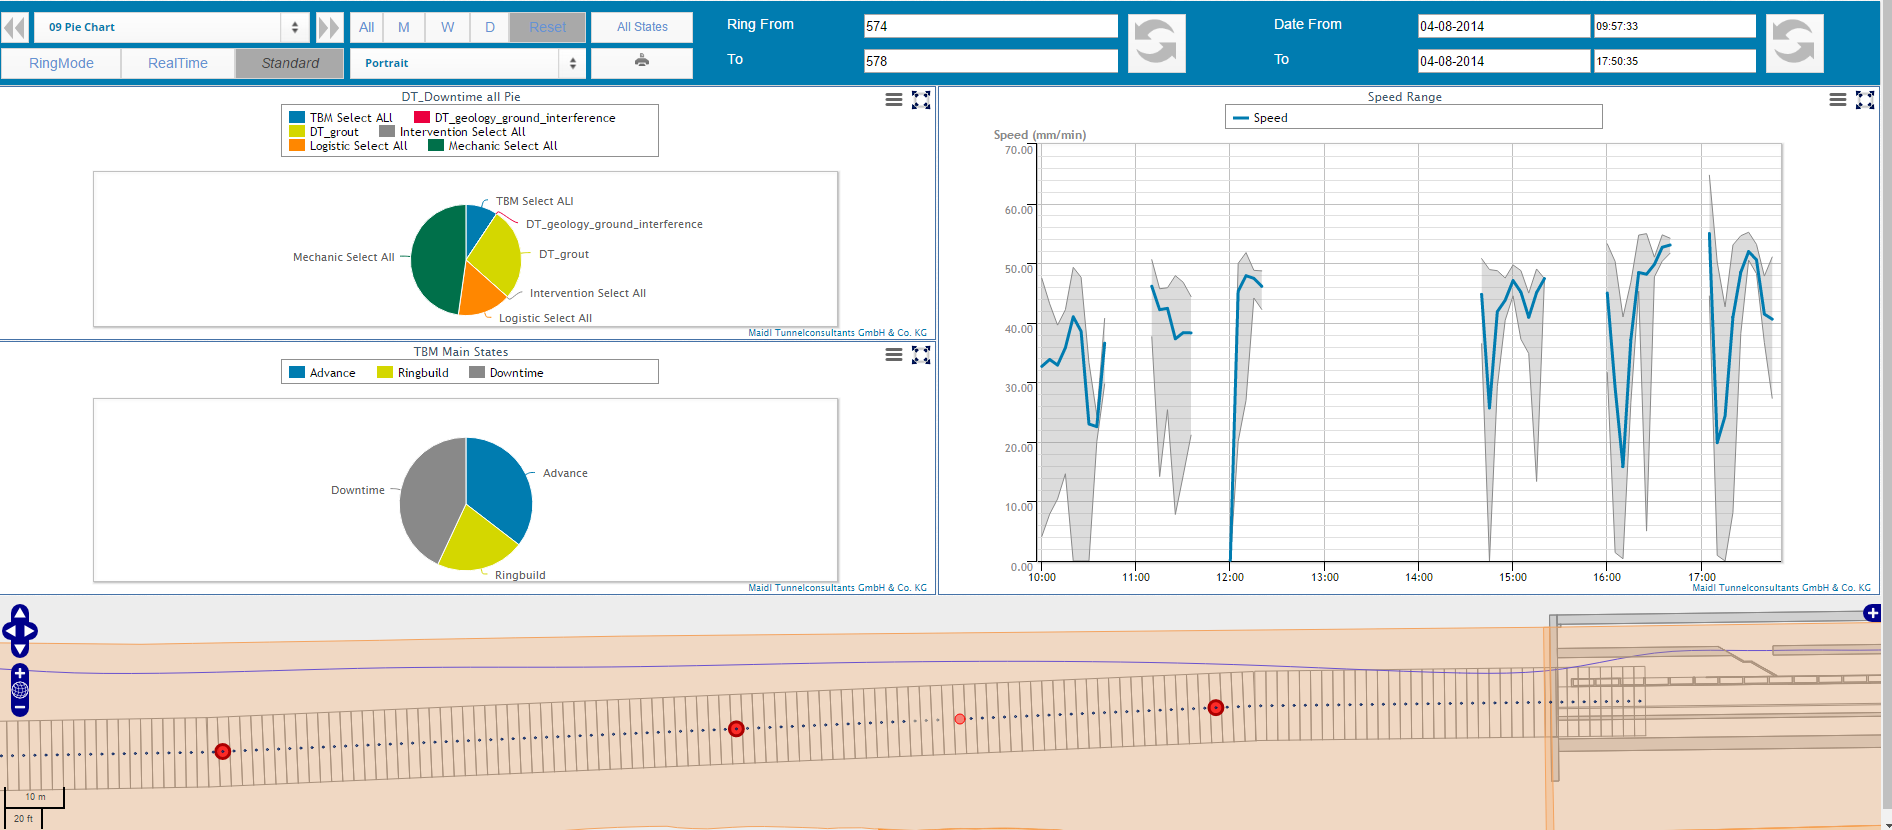
Pie ChartProcon II comes with an integrated shift reporting module. To evaluate the downtimes, the shift reporting module offers different chart types like, for example, pie charts. Here, individual downtime reasons can be evaluated as well as complete downtime groups. On the dashboard, these downtime evaluation charts can be arranged along with other elements like the geological model or machine data charts to analyze the reason for delays.
|
 |
|
1 / 7
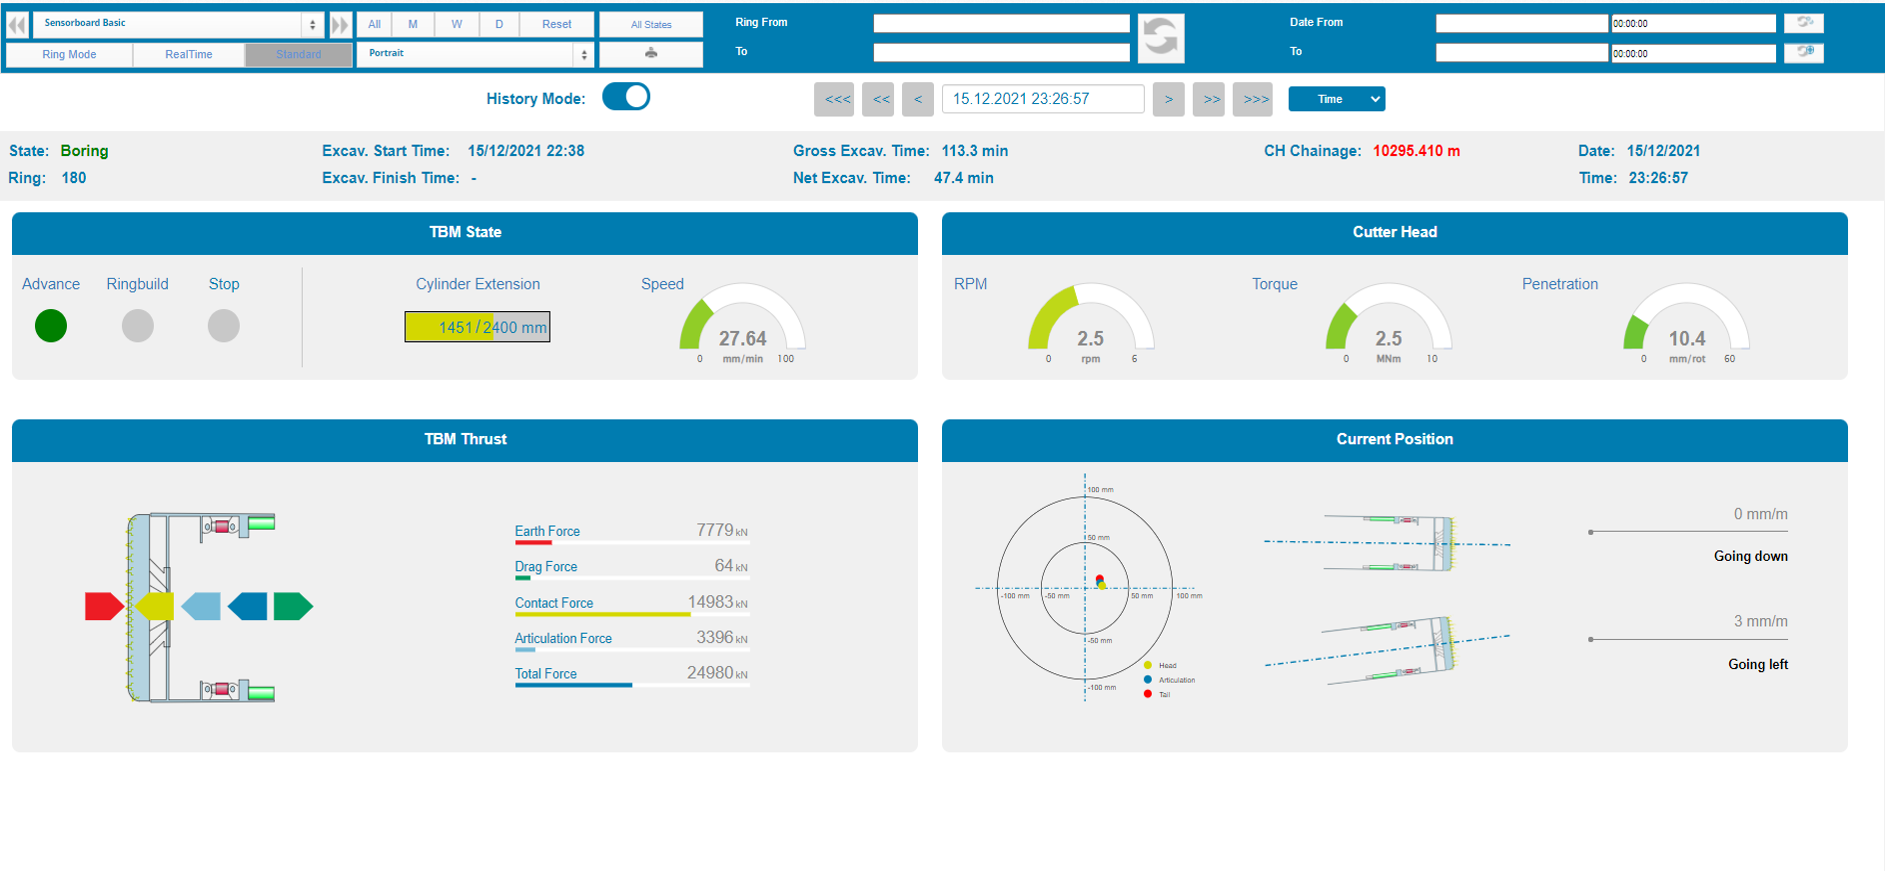
Basic Sensorboard
2 / 7
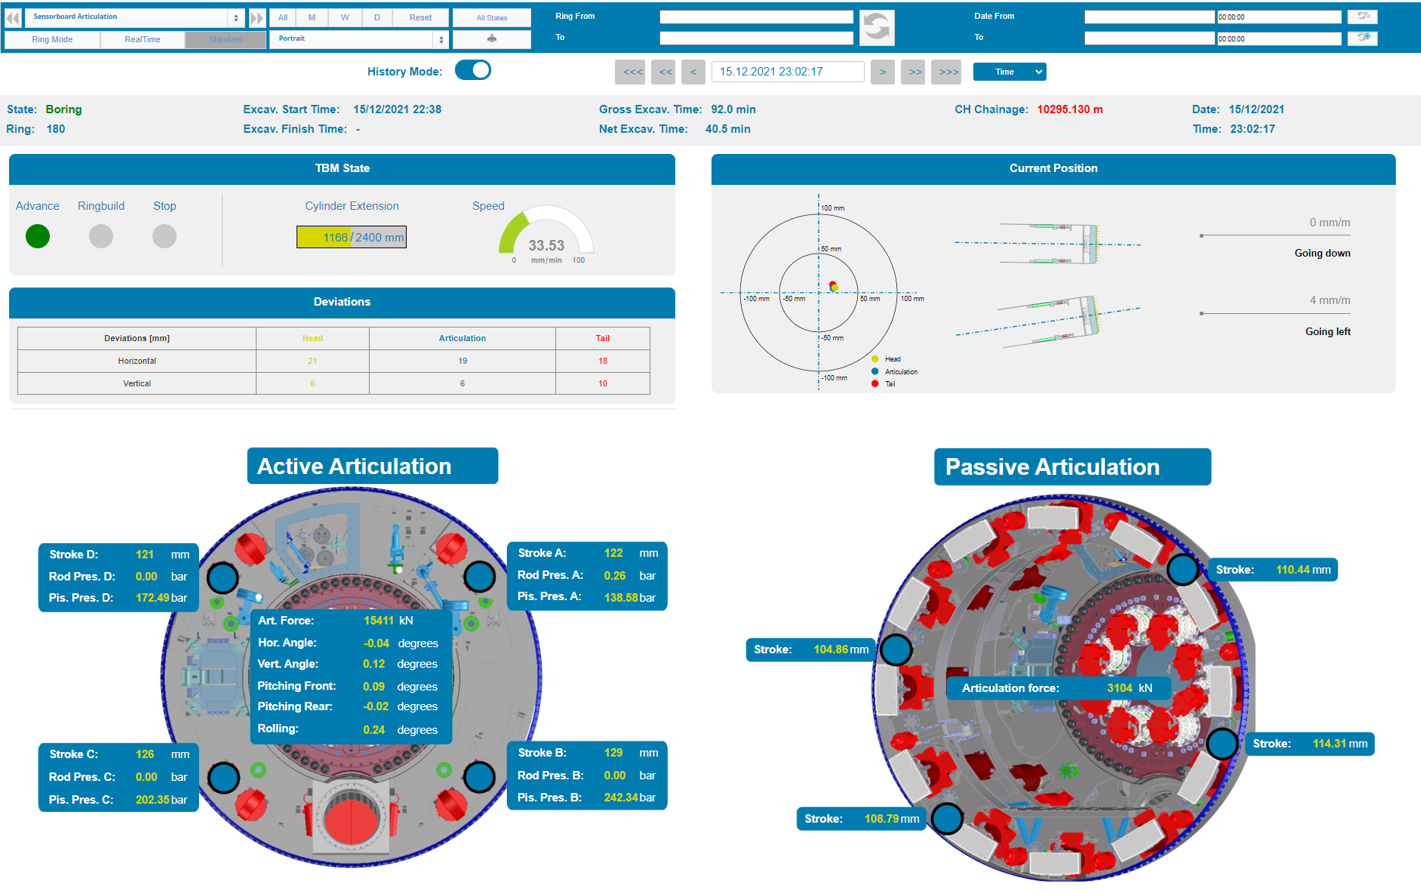
Articulation Sensorboard
3 / 7
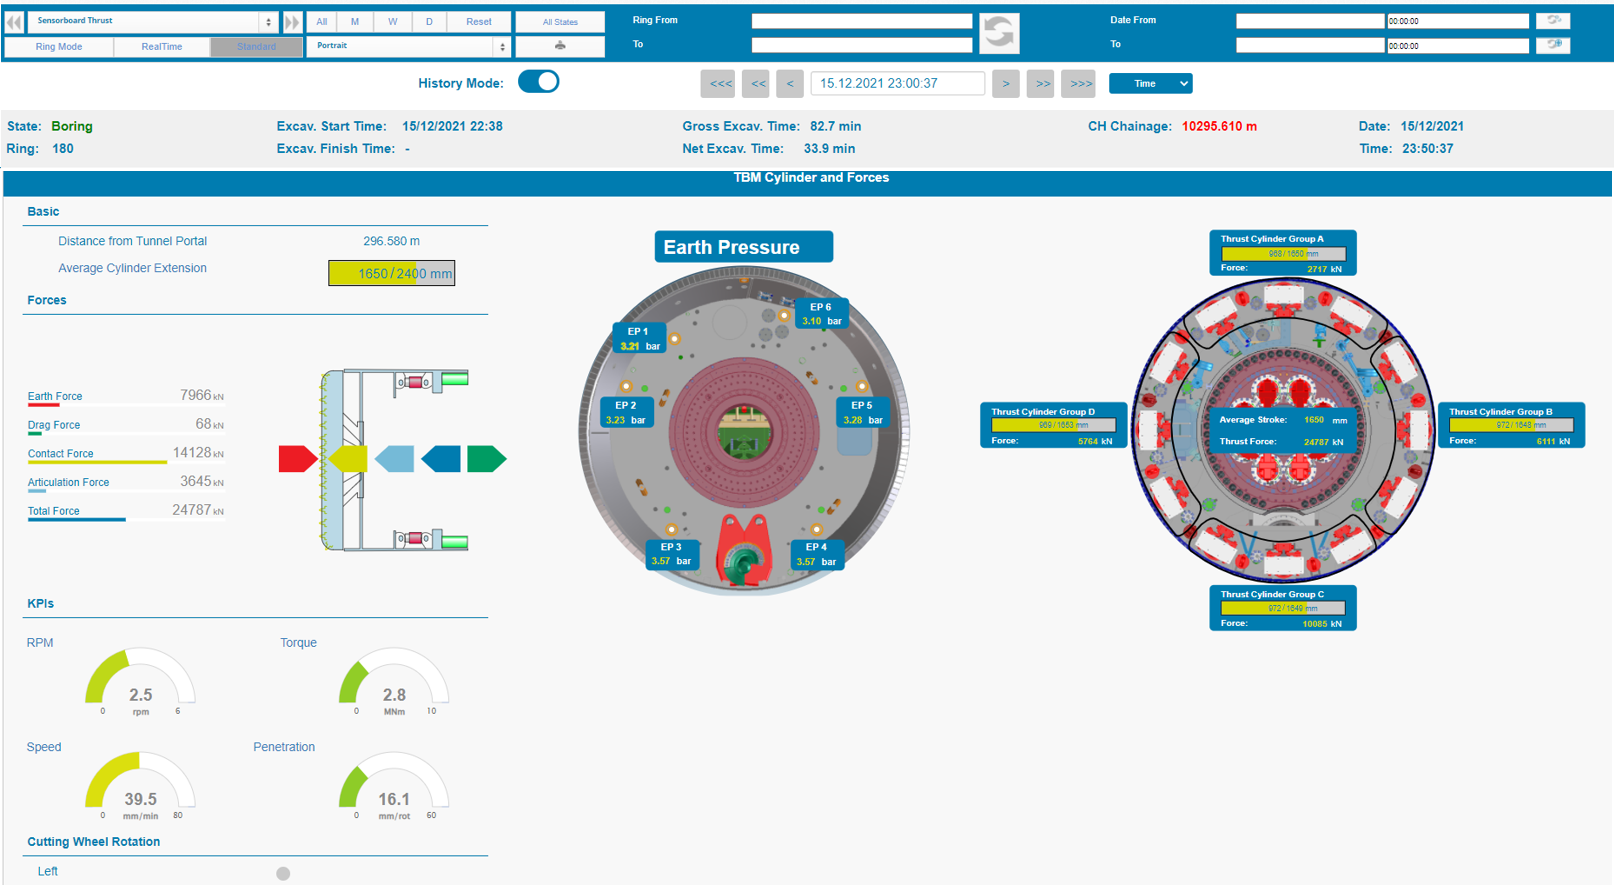
Thrust Sensoarboard
4 / 7
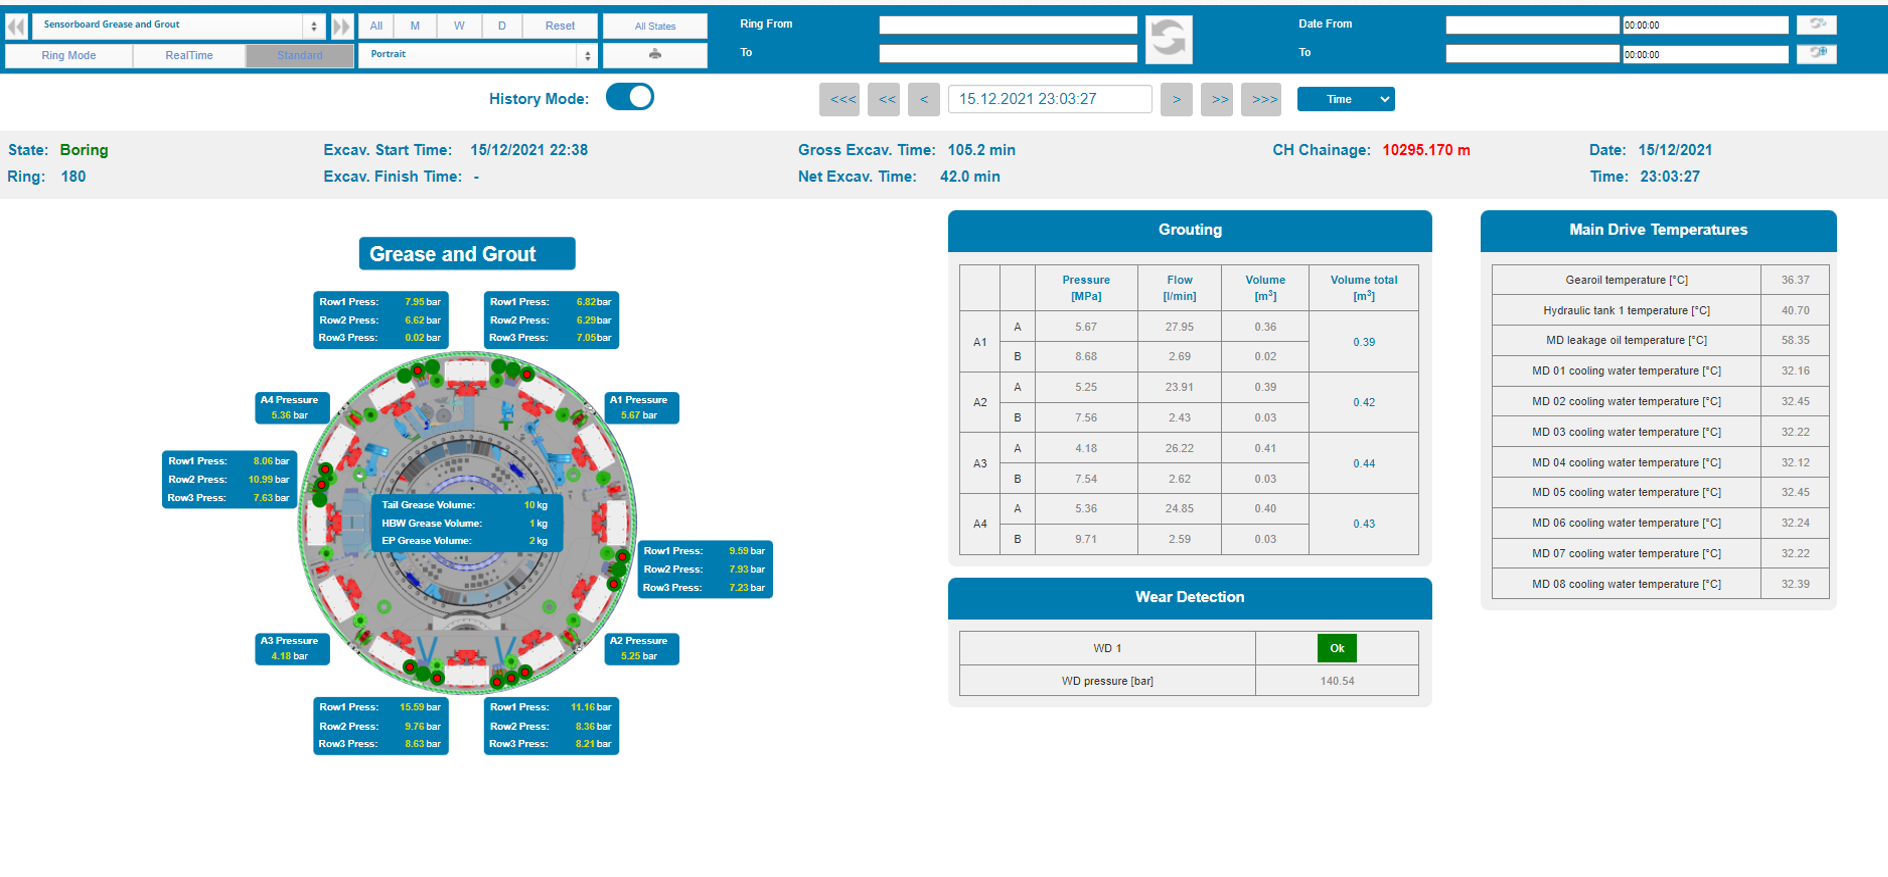
Grease and Grout Sensorboard
5 / 7
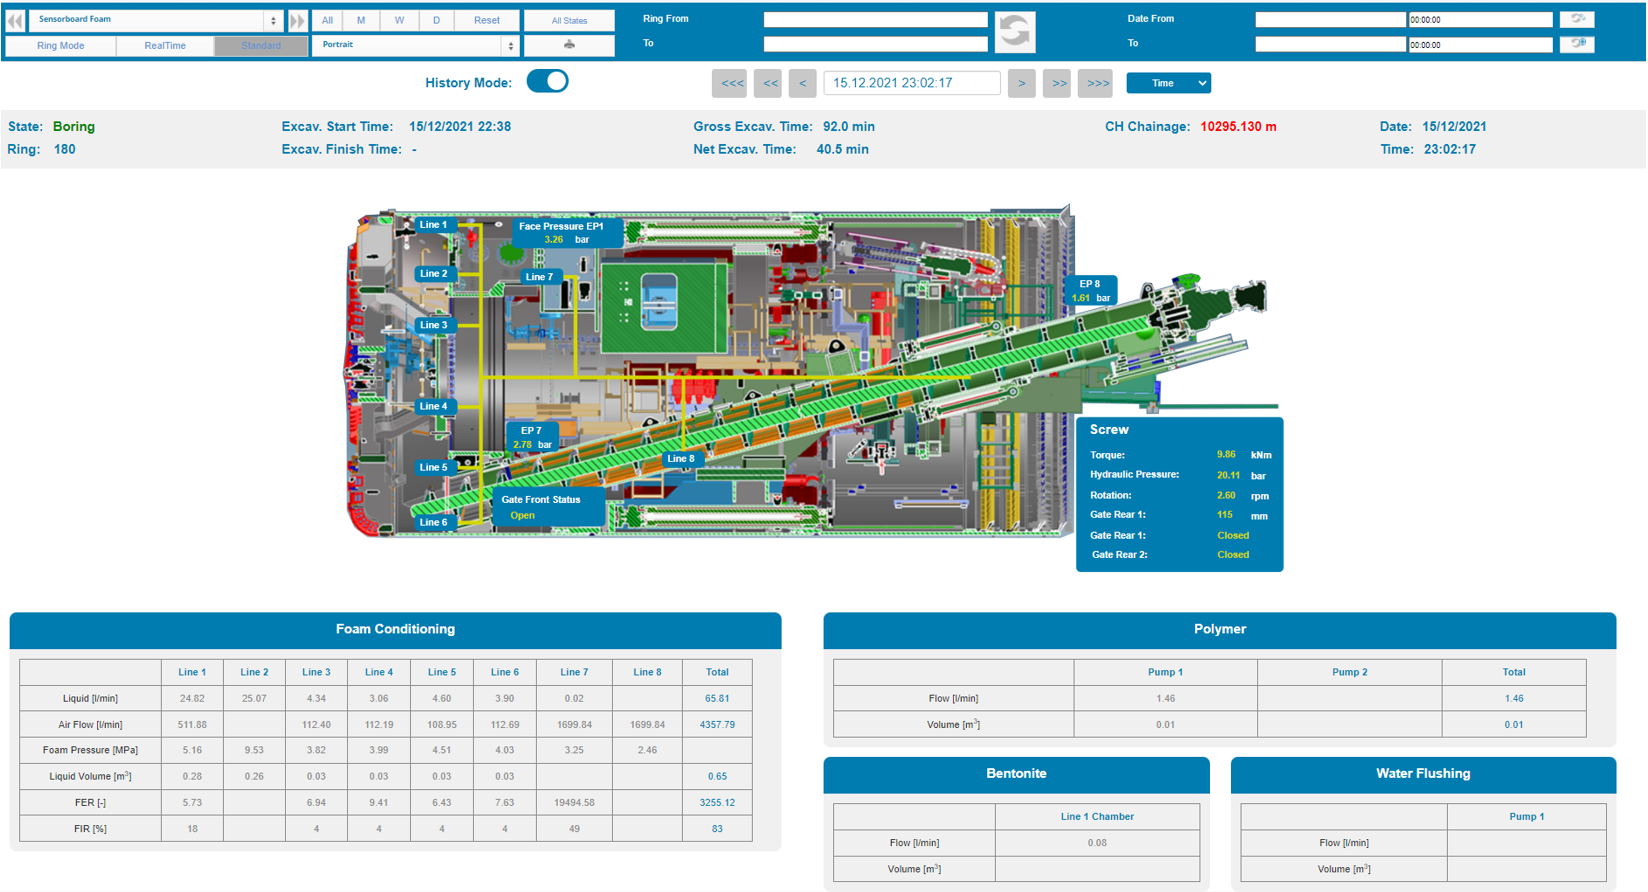
Foam Sensorboard
6 / 7
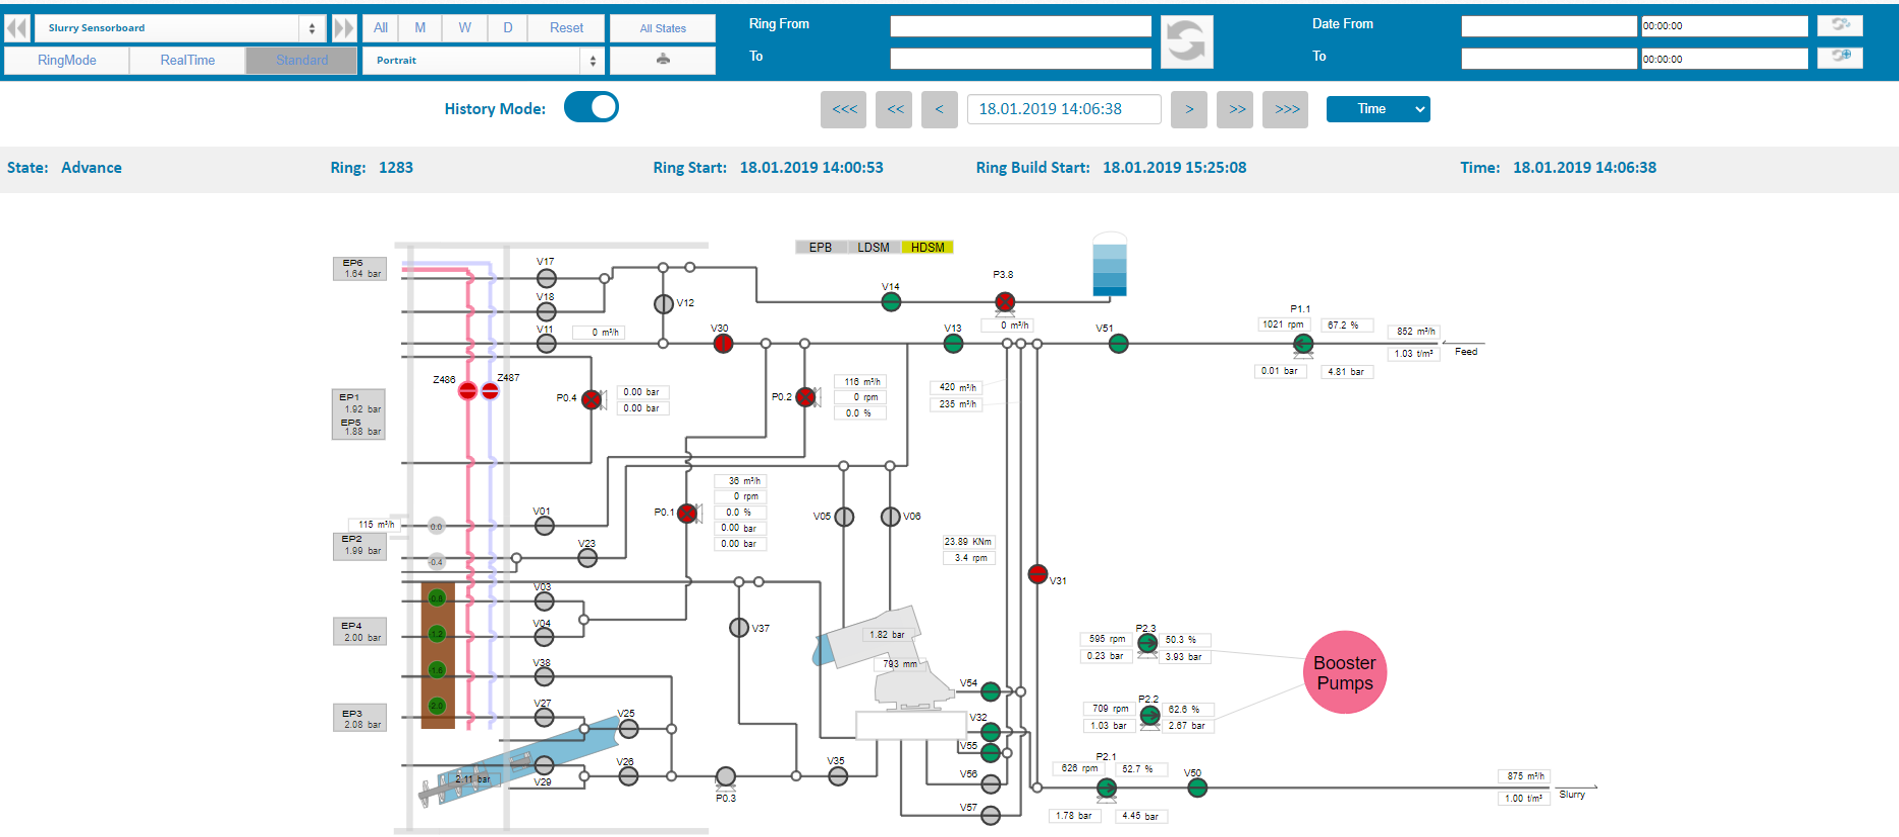
Slurry Sensorbaord
7 / 7
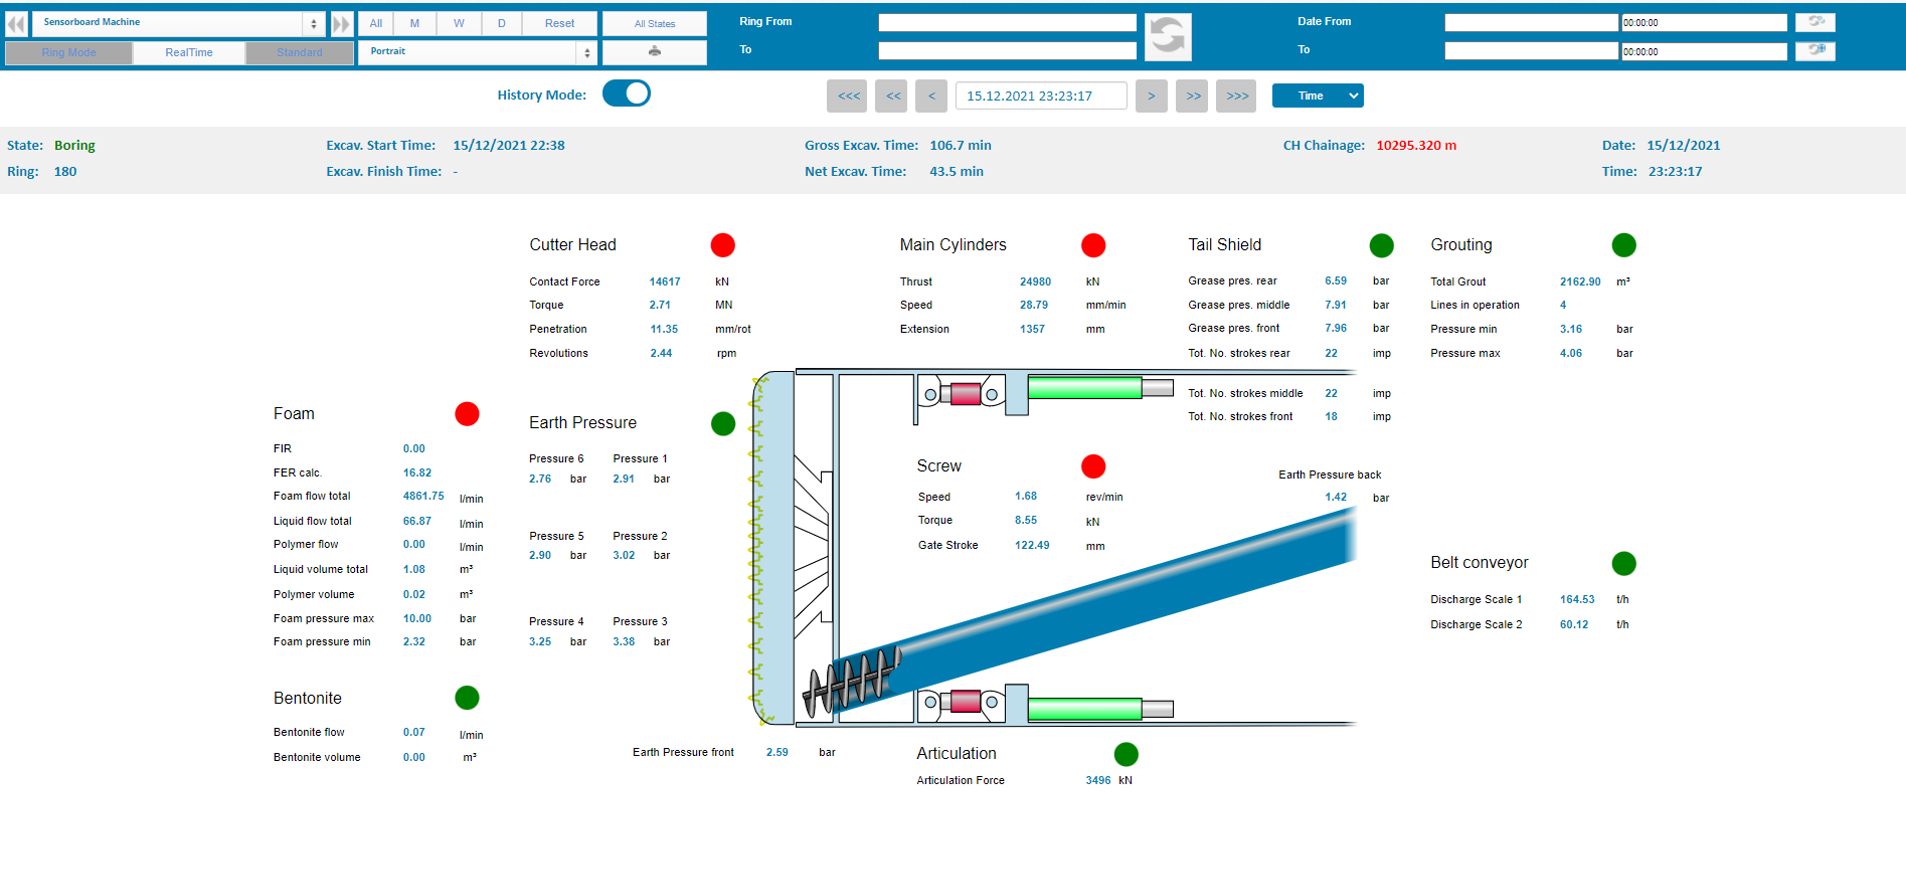
Maschine Sensorbaord
|
SensorboardFor an efficient and consistent process, mechanized tunneling requires constant surveillance. Therefore, PROCON II provides one or multiple so called Sensorboards which display the current values of a selected sample of sensors in graphical and intuitive manner. MTC provides a basic layout of the Sensorboards but it can be customized for each individual project. Our Sensorboards are optimized for mobile devices so that they can be used for monitoring the project on the go. In addition to the "advance mode" which always presents the current data, a Sensorboard can also show historical data. In the "history mode" you can jump to a defined point in time, ring, or tunnelmeter to analyse the situation at the chosen moment. For an easy navigation in the time line Quick-Select buttons have been added.
|
Advanced Analysis
The advanced analysis is a category for more sophisticated dashboards that are accessible for selected users of the system. It is reserved for complex topics, or deeper analyses of certain processes.
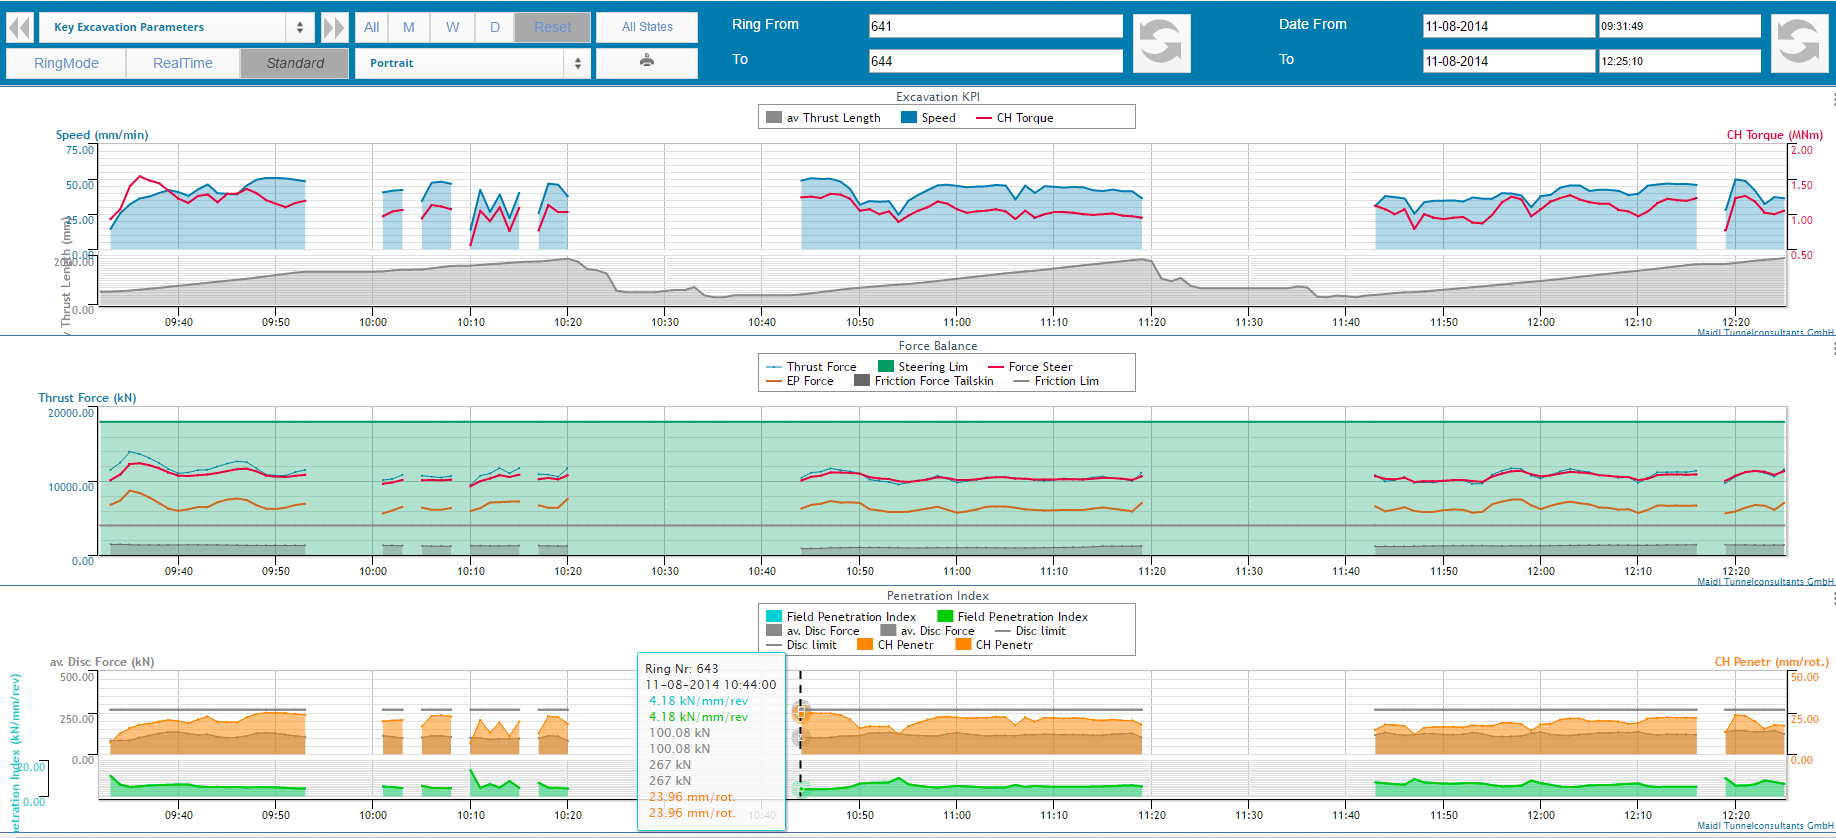 |
Key Excavation ParametersOne key process of the advance is the excavation process. Specifically designed dashboards can visualize all key parameters to this topic for a deep investigation and evaluation of the excavation.
|
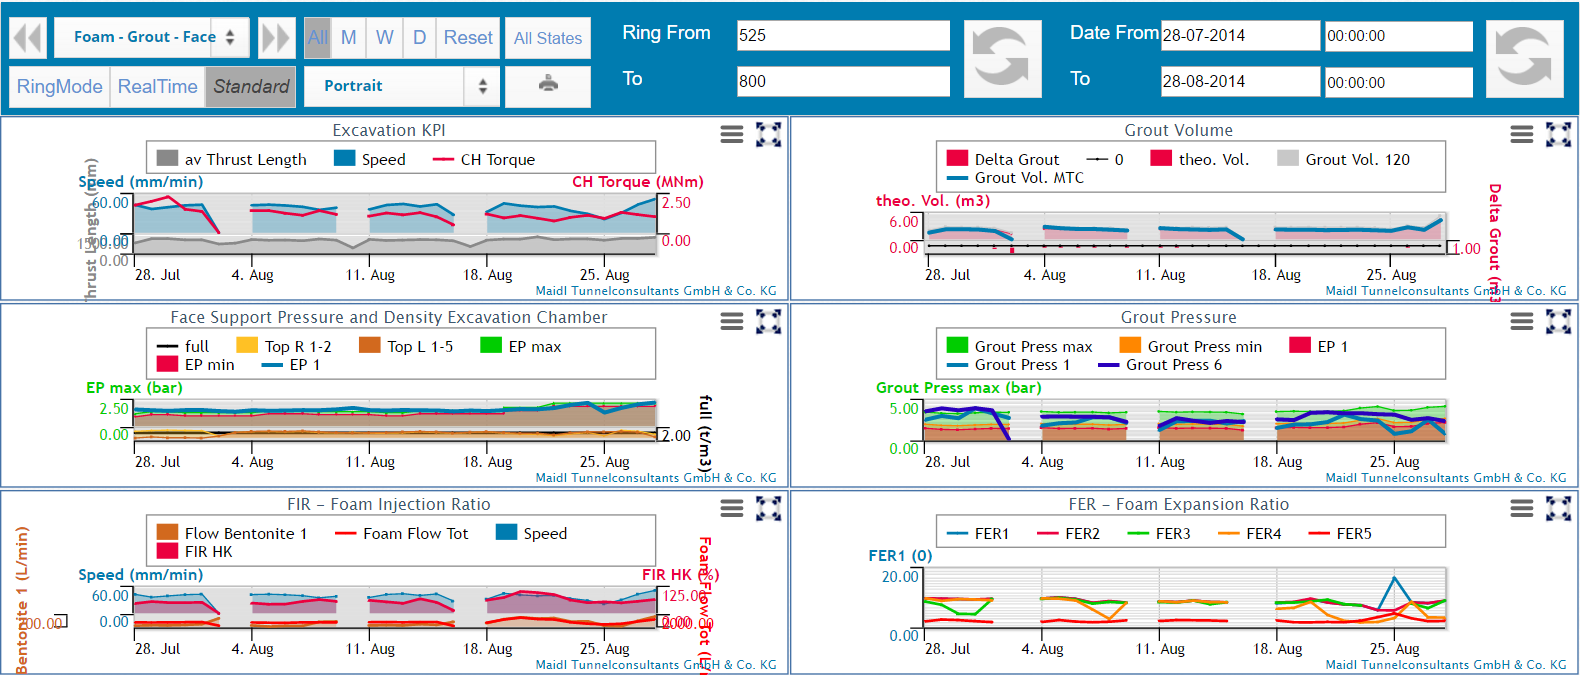
Foam Grout Face PressureAnother important process of the advance is soil conditioning at the tunnel face. Many different aspects and parameters have to be considered, which can be visualized on one dashboard to make informed decisions.
|
 |
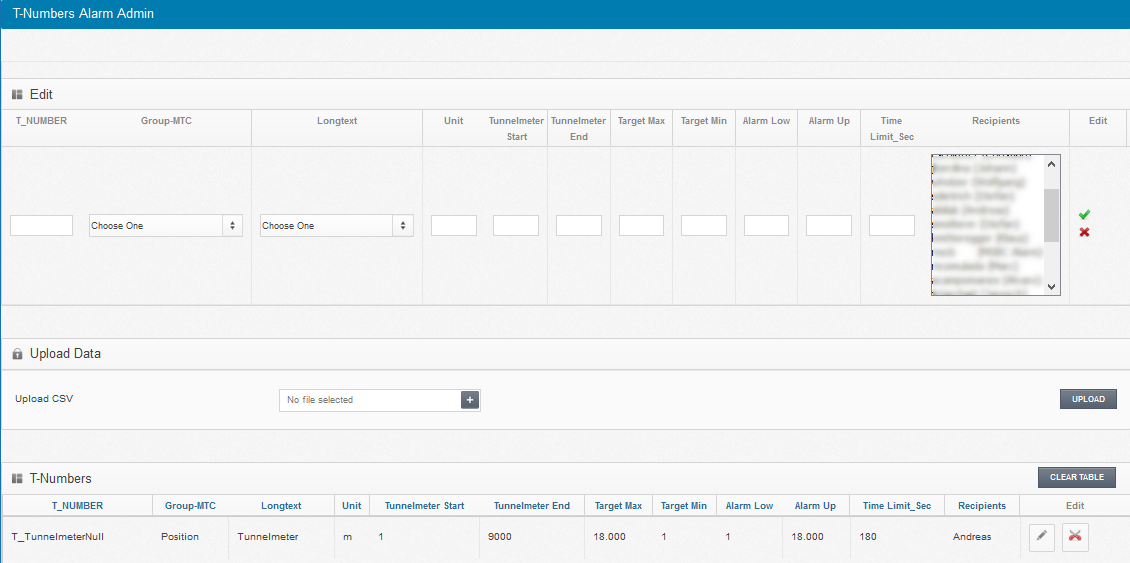 |
Alarming and MessagingThe simultaneous storage and common referencing of target and actual values allows for automated alarming that is seamlessly integrated in PROCON II. Using the common location-and-time reference system, any violation of user-defined thresholds can be set to trigger an e-mail alarm to selected users. An e-mail alarm can be further configured by defining how long a threshold has to be violated before sending an alarm. Additionally, a period can be provided which has to pass before sending another message. Furthermore, hazards can be displayed in the built-in map feature to assist with a quick location of potential problems. Using the alarming and messaging system, potential hazards can be communicated to the responsible persons in real time such that required counter measures can be initiated without delays. Many hazardous situations can be prevented or diminished by quick reactions. |
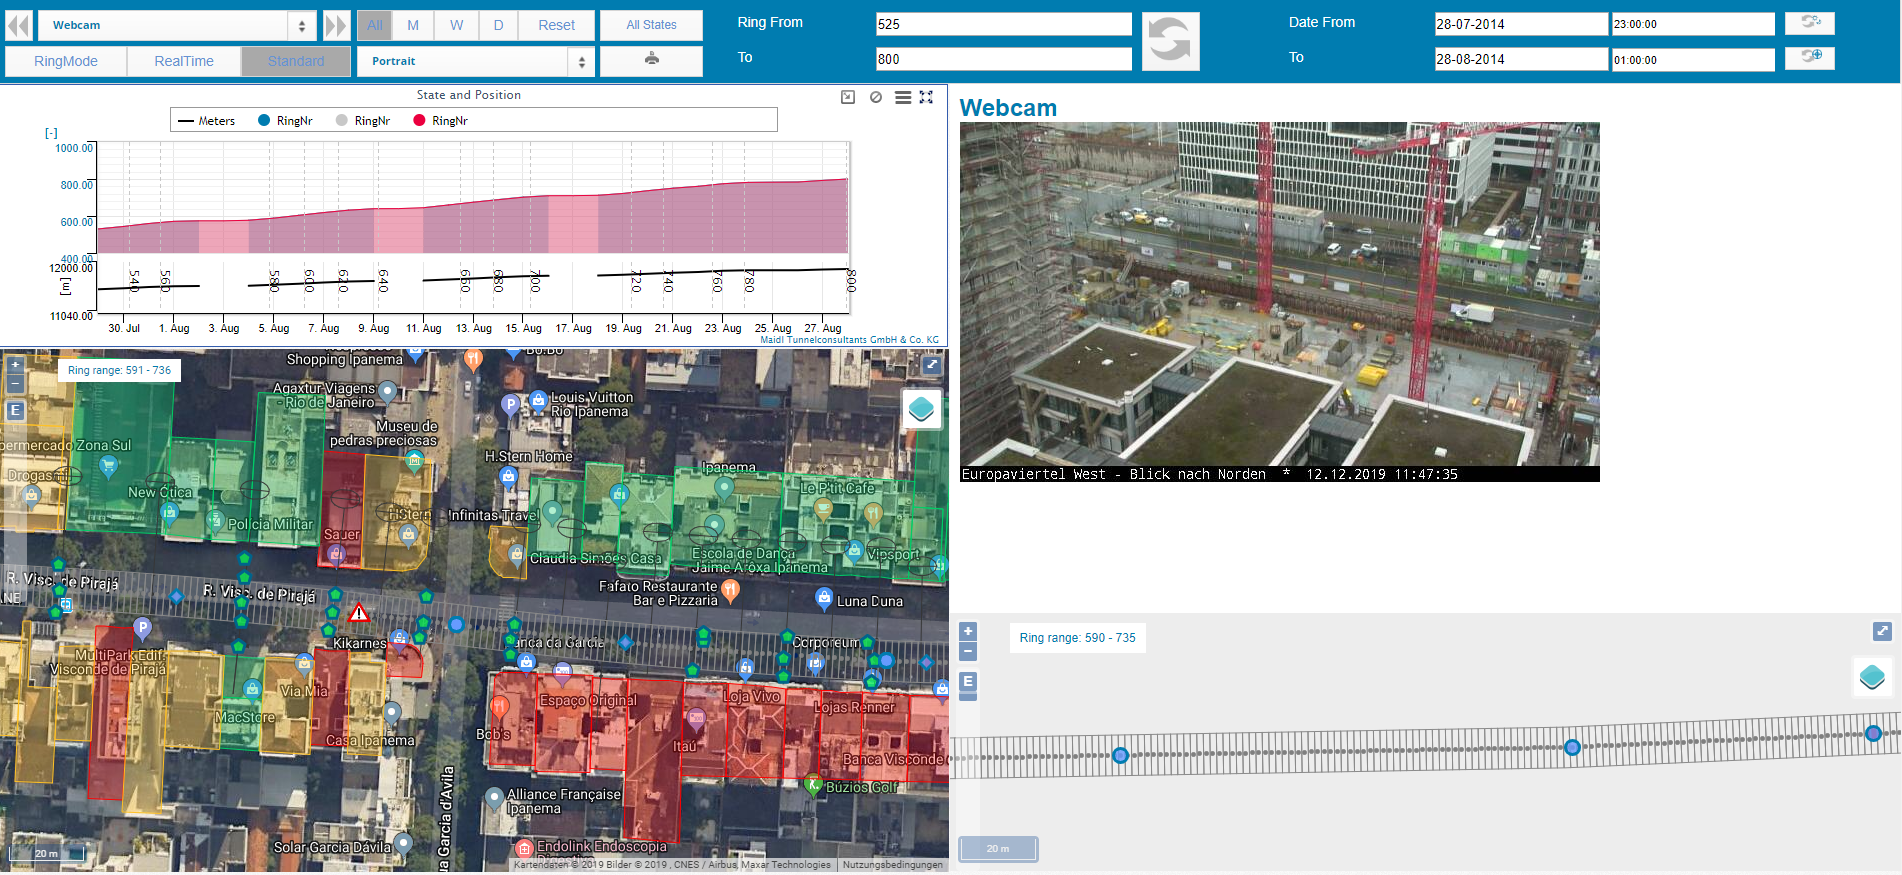
WebcamFor additional project monitoring, video surveillance is often used. Live streams from online webcams can therefore be integrated in PROCON dashboards such that video feed is available alongside all other project information. Thus, you can monitor processes on the construction site from everywhere and interfere if required.
|
 |
Shift Reporting
An interactive module for shift protocols extends the list of
optional features of PROCON. Extracting periods of advance, ring
building and standstill automatically from the machine data,
these time intervals are displayed using a Gantt chart
visualization for each shift.
Shift reporting represents
an essential element of the documentation of a tunneling project.
All actions are documented and can be evaluated as well as
exported. In Procon II, multiple types of shifts per day can be
generated like a morning, day and late shift. The key processes
like advance and ring build are automatically retrieved from the
machine data and assigned to each shift. The reason for each
downtime slot needs to be specified by the user. Here, the
catalog of downtimes is specified according to each project's
requirements. Based on the documented downtime reasons,
evaluations can be performed based on which the process can be
optimized.
For detail evaluations, additional filters on
specific shifts or staff members can be used, hence allowing for
an assessment of reasons for performance differences among the
shifts or to identify specific parameters that correlate with the
performance. The integrative nature of the data warehouse and the
unified temporal and spatial reference system helps identifying
previously unknown interactions and hidden mechanisms in the
process.
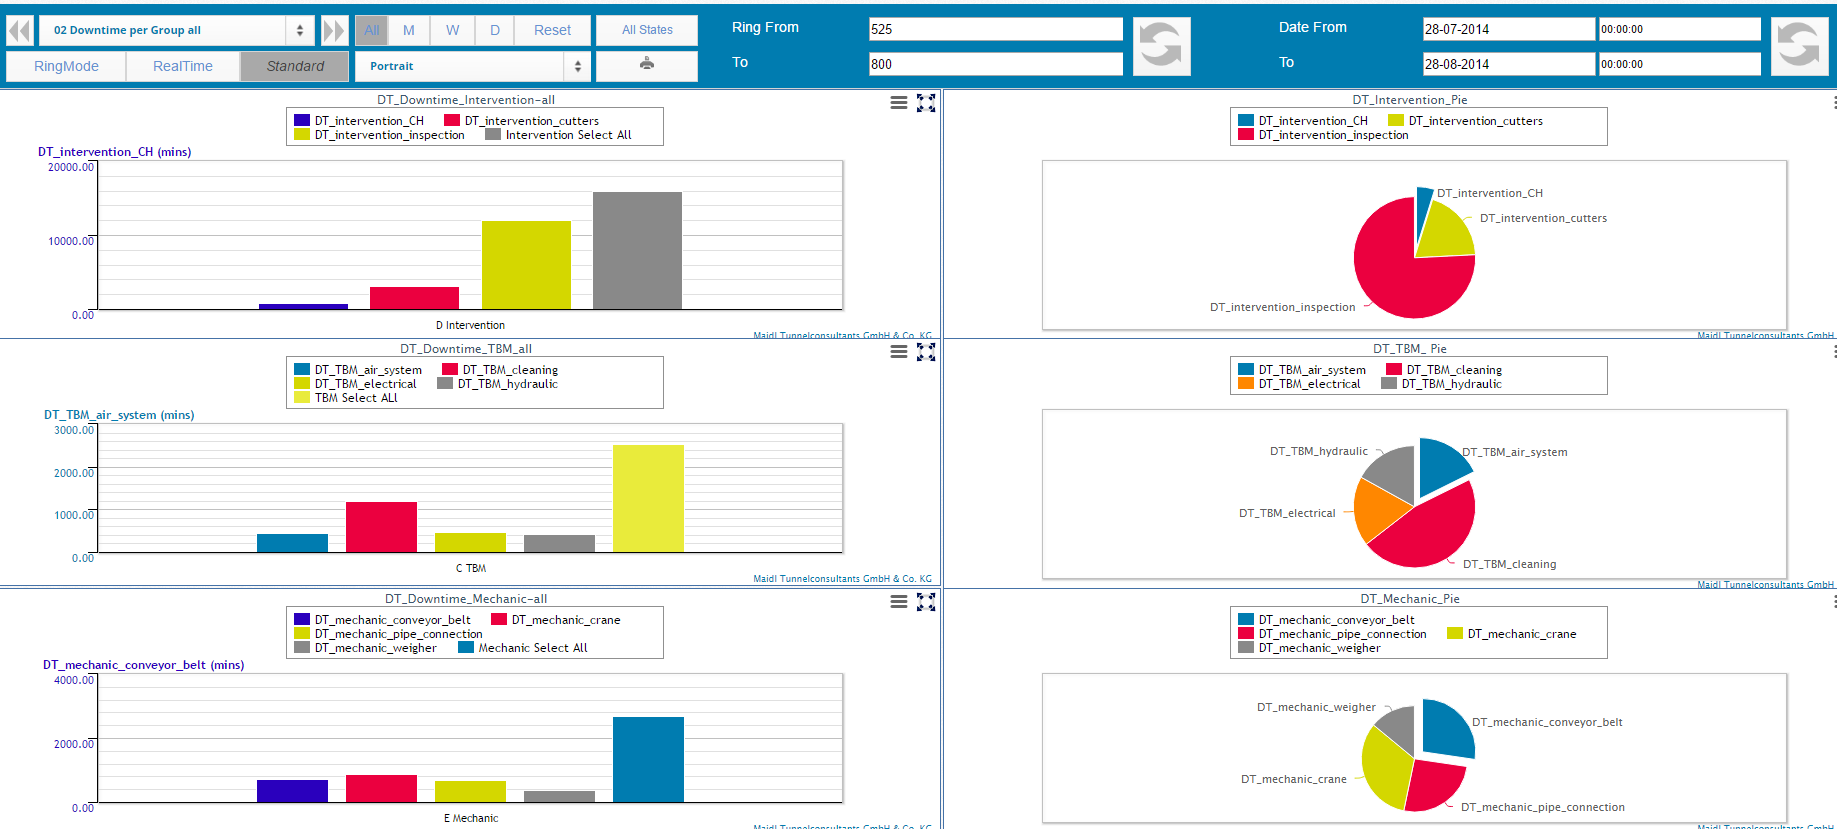 |
Evaluation of all GroupsEvaluate the downtime distribution and analyze the reasons for performance issues using different visualizations like pie charts or bar charts. In those charts, either specific codes can be captured or a whole group code. In this example, groups of codes are selected. The x-axis of the downtime bar charts can be selected as required. For example, the downtimes can be evaluated by ring, by day or by week. Combining this information, all processes in excavation can be analyzed regarding their time and cost structure. Here, all information stored in PROCON can be employed, like, e.g. geological information or machine data.
|
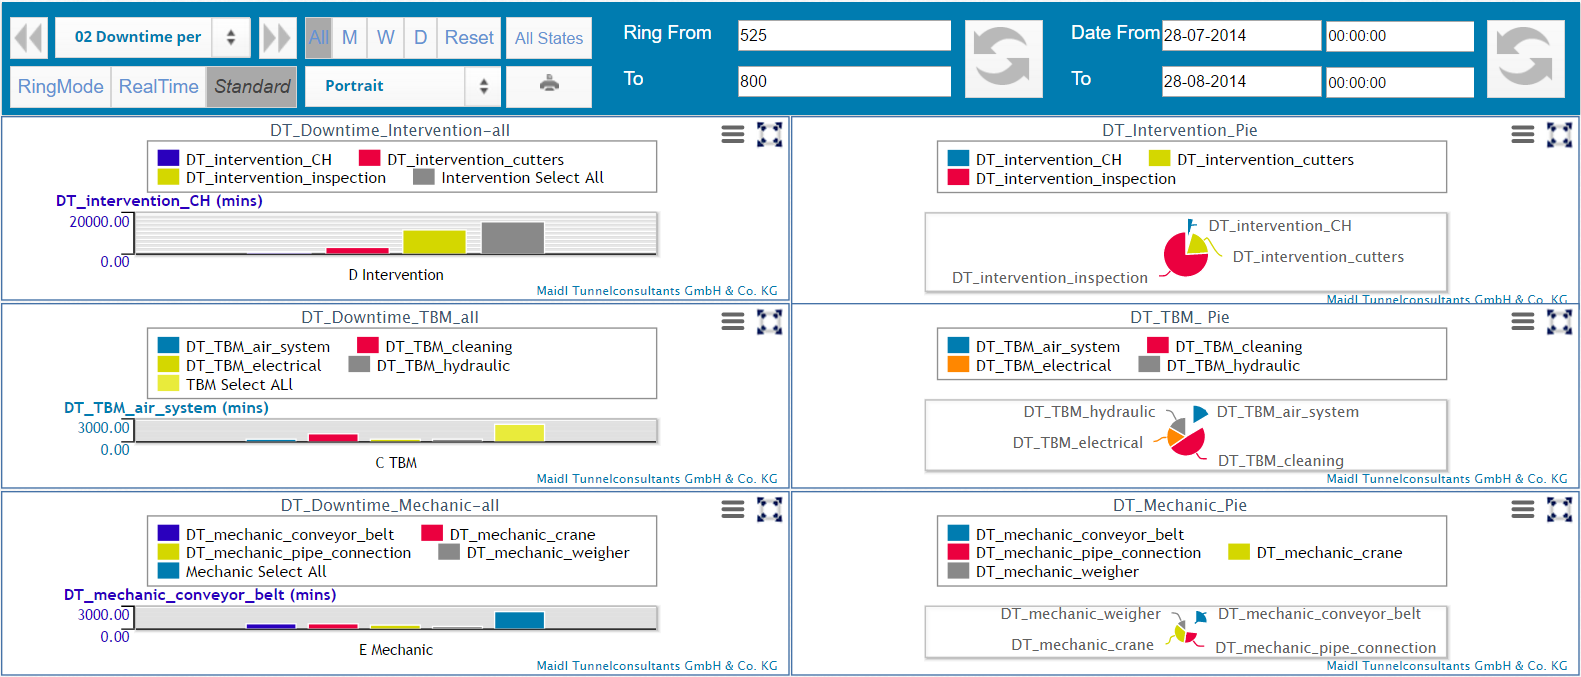
Evaluation per CodeThe downtime evalauation can also be performed code-based. In this example the downtimes of an individual downtime group are investigated based on different chart types. On the x-axis of the bar chart a downtime group is shown.
|
 |
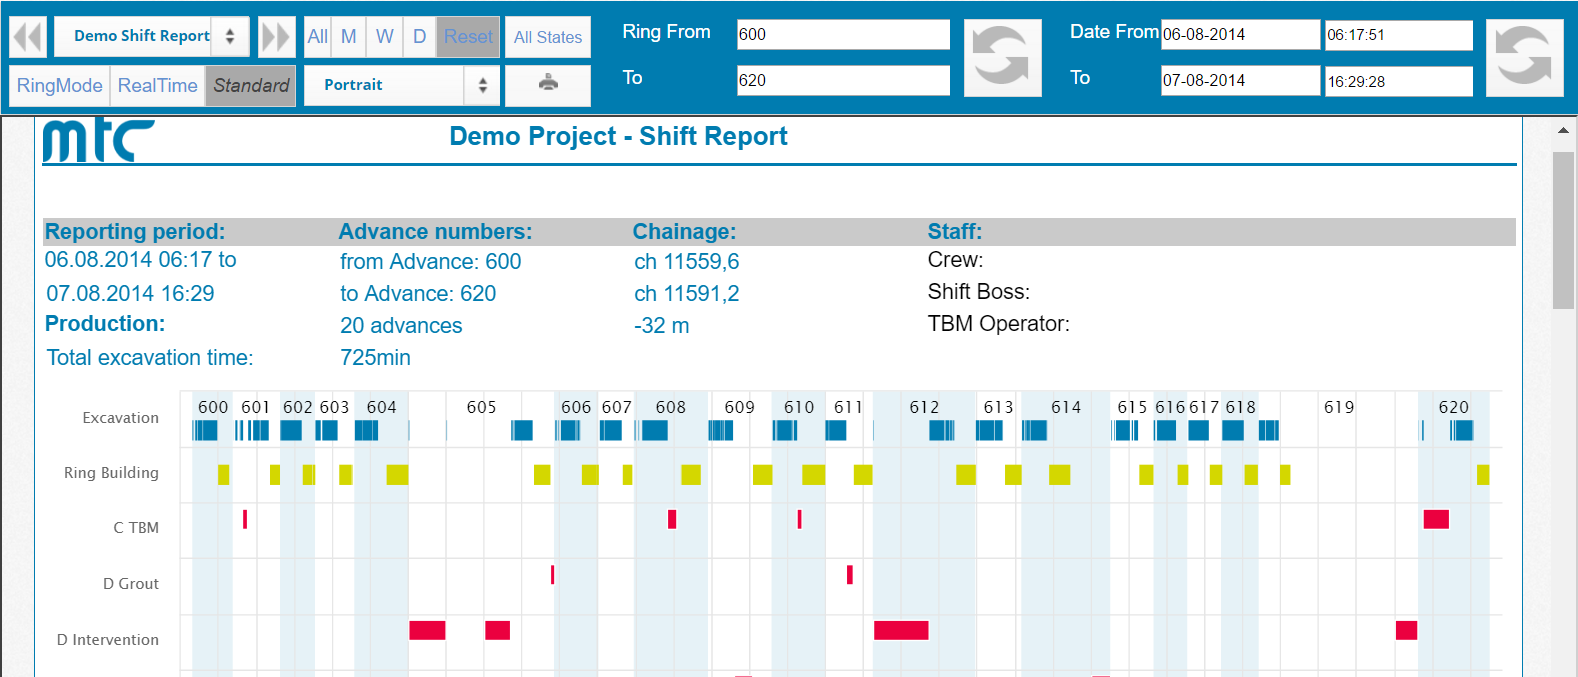 |
Shift ReportThe presented shift report is a customized report. It can be adapted specifically for your needs. In the report the individual downtimes are visualized in a Gantt chart and listed in a table underneath. Additionally, the main downtime reasons are provided.
|
Downtime ReportThe planned processes and downtime durations can also be visualized in usual charts. Additionally, other pages, e.g. of Procon, can be integrated into a dashboard for operation. Here, the page for data input is integrated into the dasboard so that you can easily enter the specific downtime reasons in context of the overall advance progress.
|
 |
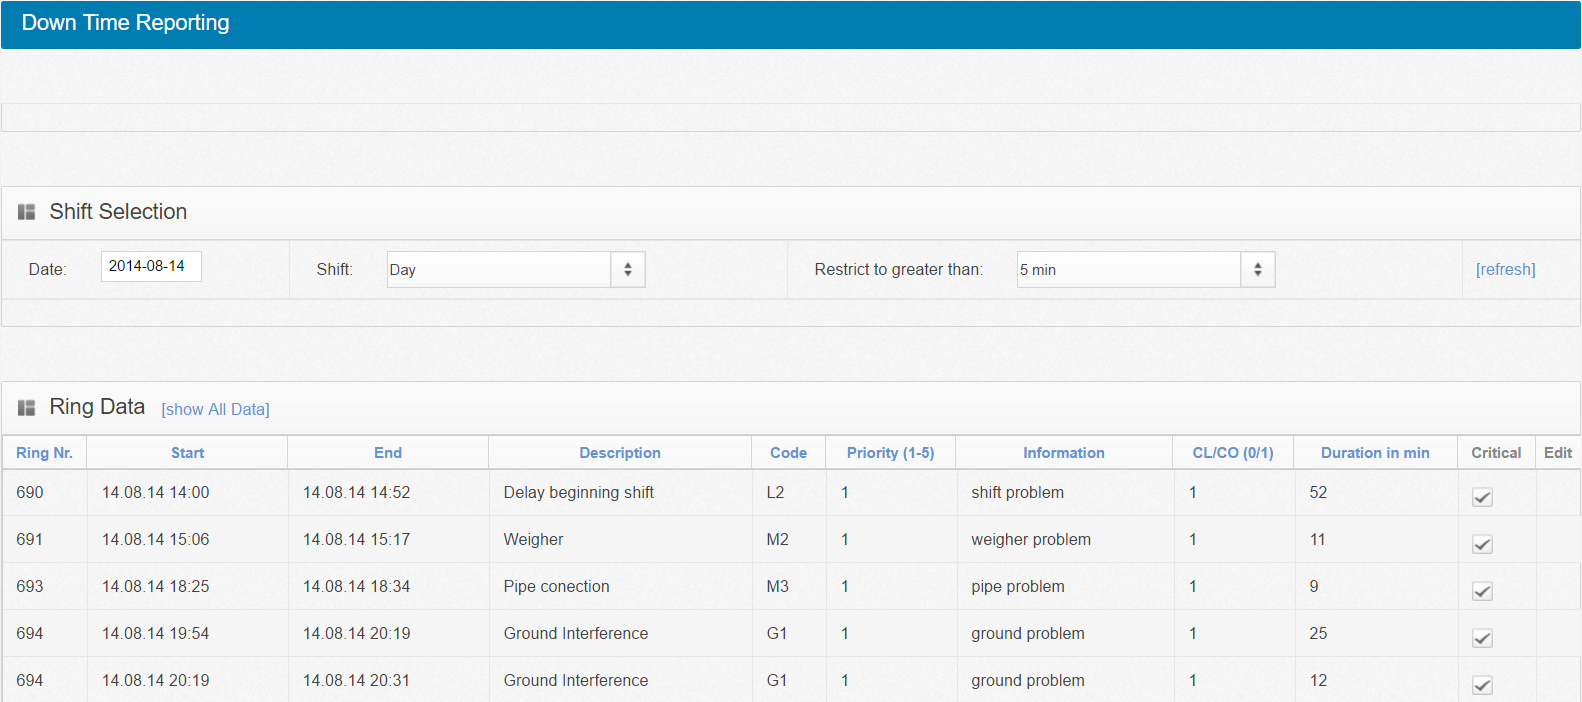 |
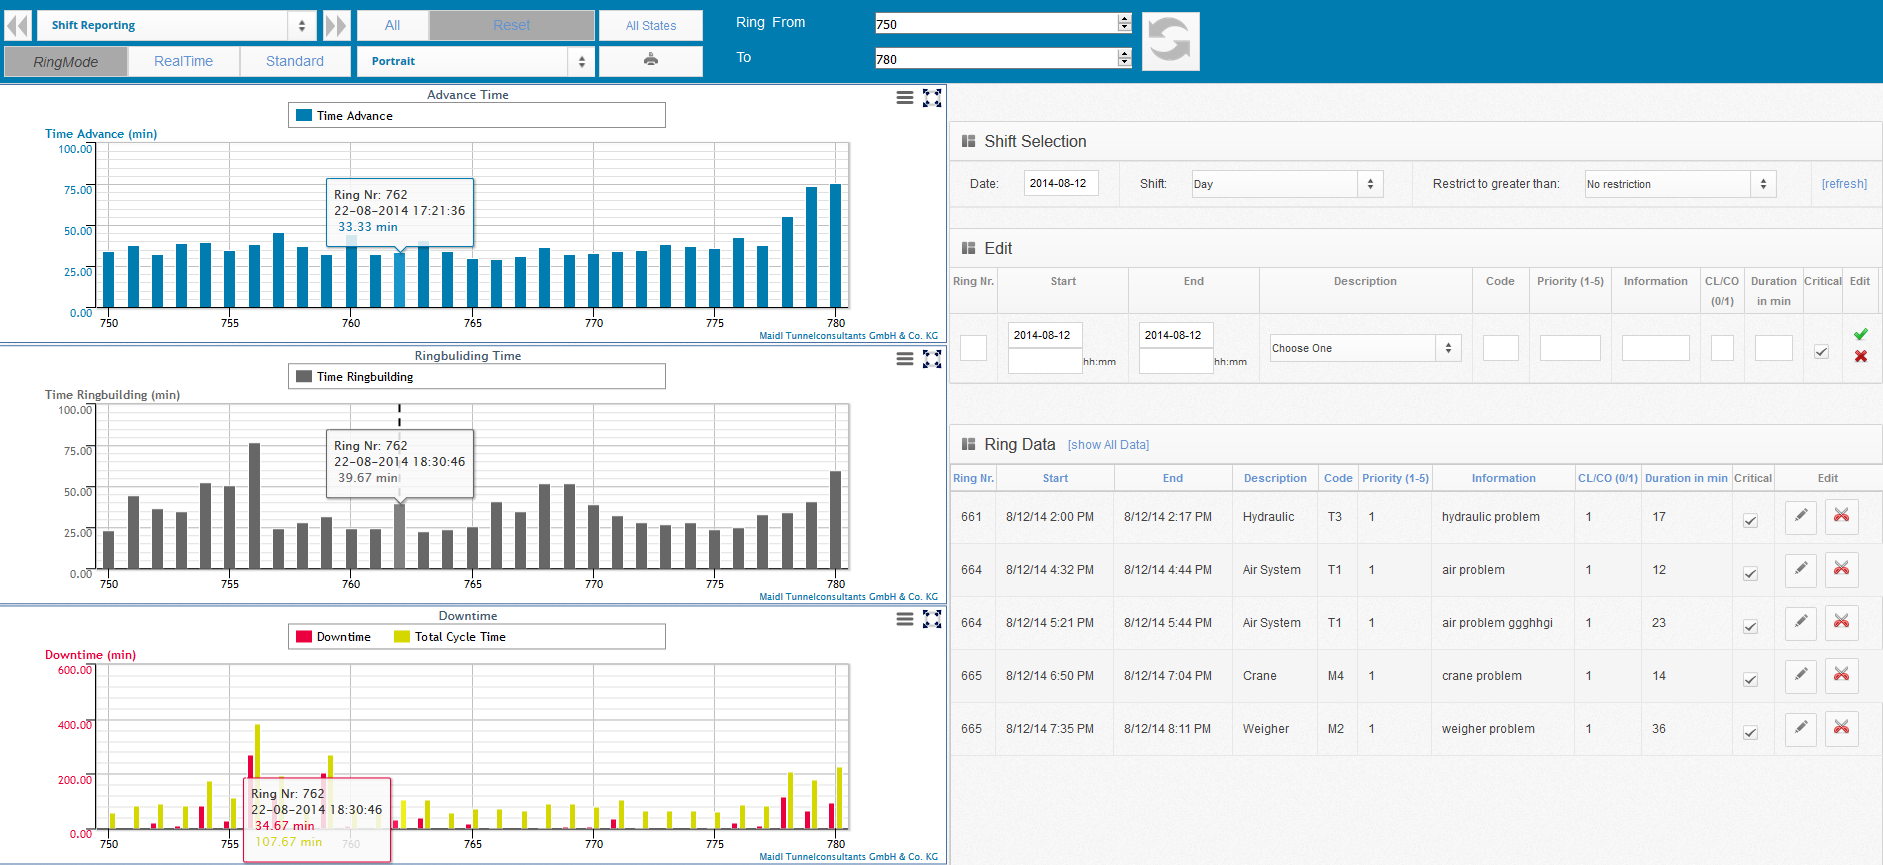
Downtime ConfigurationThe individual downtimes for each shift can be entered in a simple mask. A gantt chart on the top of the page shows the main processes advance, ring build and downtime along with already configured downtimes. The share of each main process is shown in an adjacent pie chart. Each process is assigned to a ring number that serves as location reference and helps analyzing the downtimes for each ring separately. The entered downtimes can either be critical or non-critical. Non-critical downtimes can overlap other critical tasks whereas critical process and downtimes are not allowed to overlap. If required, those downtimes which have not been assigned to a downtime category (e.g. because they are too small), can be automatically be assigned to an uncategorized downtime category to ensure that all downtimes are captured. Additionally, many smaller downtimes can be merged to one bigger one, if this is required to document the shift. Important: To see entered downtime on the demo page, please select either a ring (range: 525 - 800) or a date in the "Shift Selection" (range: 27.07.2014 - 27.08.2014), a shift type and, optionally, a time restriction. Next, click on the "refresh" link on the right.
|
Cutter Tool Management
The management of cutter tools is very important especially when
excavating in hard rock. The wear of the individual cutter tools
must be documented to prevent the tunneling machine from being
damaged due to worn-out tools. In Procon II, the individual tools
can be registered and maintained. Data can be entered based on
interventions which represents an event when the cutter tools are
checked for their current wear and changed, if required. Types of
cutting tools like disks, scrapers and buckets are distinguished
in the system and can be managed in respective user interfaces.
The entered intervention data can be displayed using Procon's
chart and dashboard configurators. Here, the tool consumption can
be correlated with machine data and geology information. Thus,
evaluations can be performed of the required tools in context of
the excavated ground. Following the identification of those wear
mechanisms, the prediction of the tool service life can be
improved and maintenance intervals can be optimized, reducing the
risk of unplanned standstills.
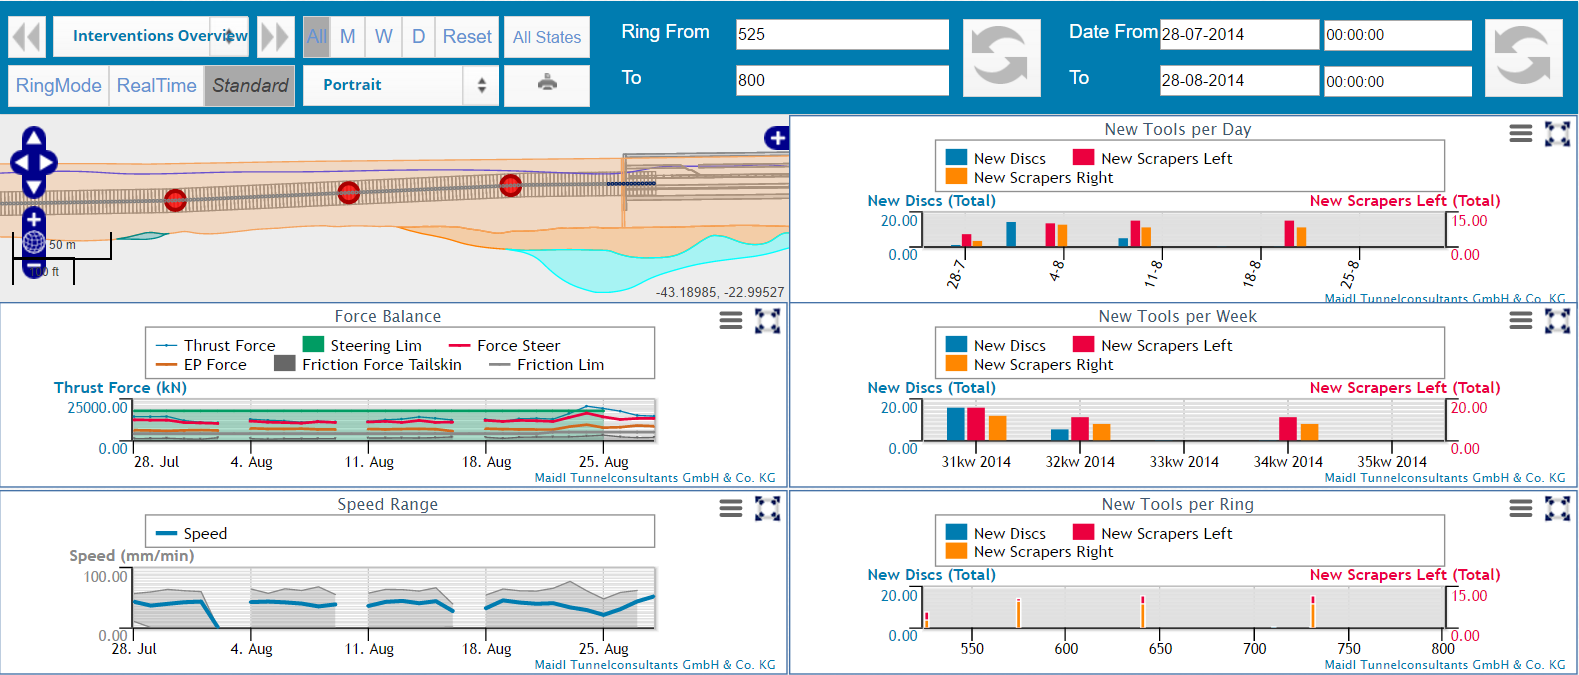
Intervention OverviewCorrelating maintenance logs with the digital ground model, data mining and data analysis tools can be further employed to detect the influence of certain ground properties, types of tools and driving parameters on the tool wear. In this context, the number of changed tools of different cutter types can be combined in one chart, represented in different compressions like per ring, per day or per week. This data can be arranged on a dashboard along with data which influences the tool abrasion like the geology or the thrust force. Based on this assembling of data the advance can be evaluated and informed decisions can be made to improve the excavation process.
|
 |
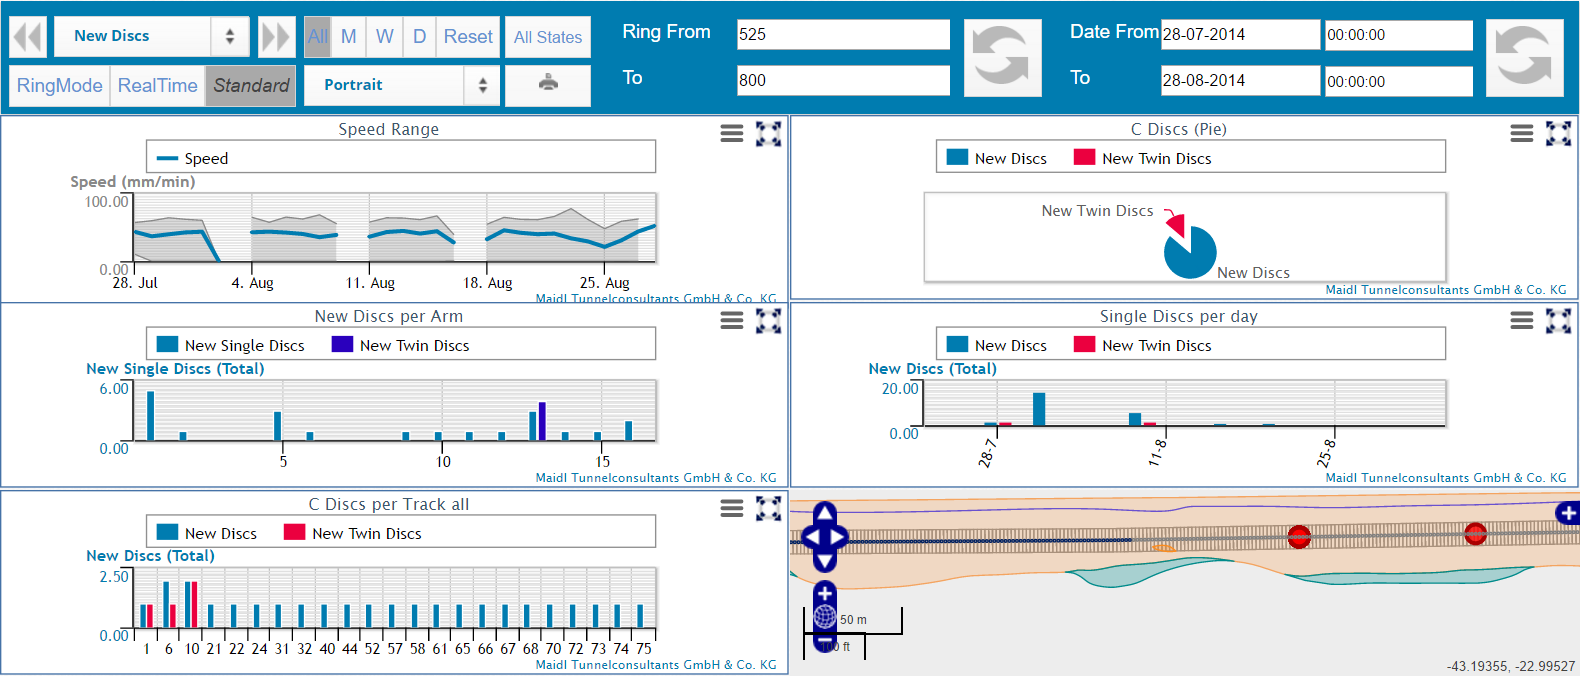 |
New DisksEvaluations can also only be performed for a specifically selected tool type like disk cutters or scapers.
|
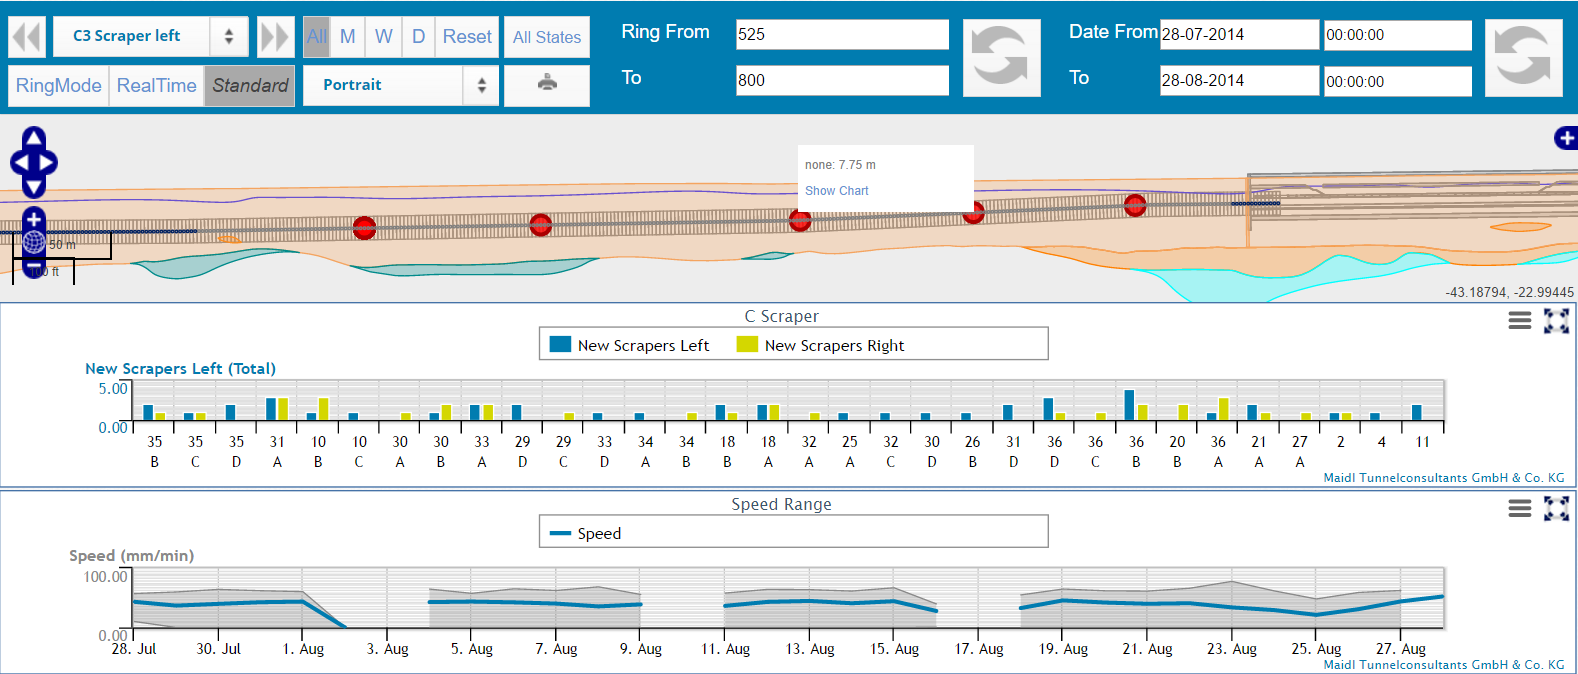
Scraper left and rightCutter tools can not only be evaluated based on the time but also based on their track. For each track the performed operations like tool changes can be visualized in a chart. Of course, all in the context of influencing parameters like ground conditions or penetration rate.
|
 |
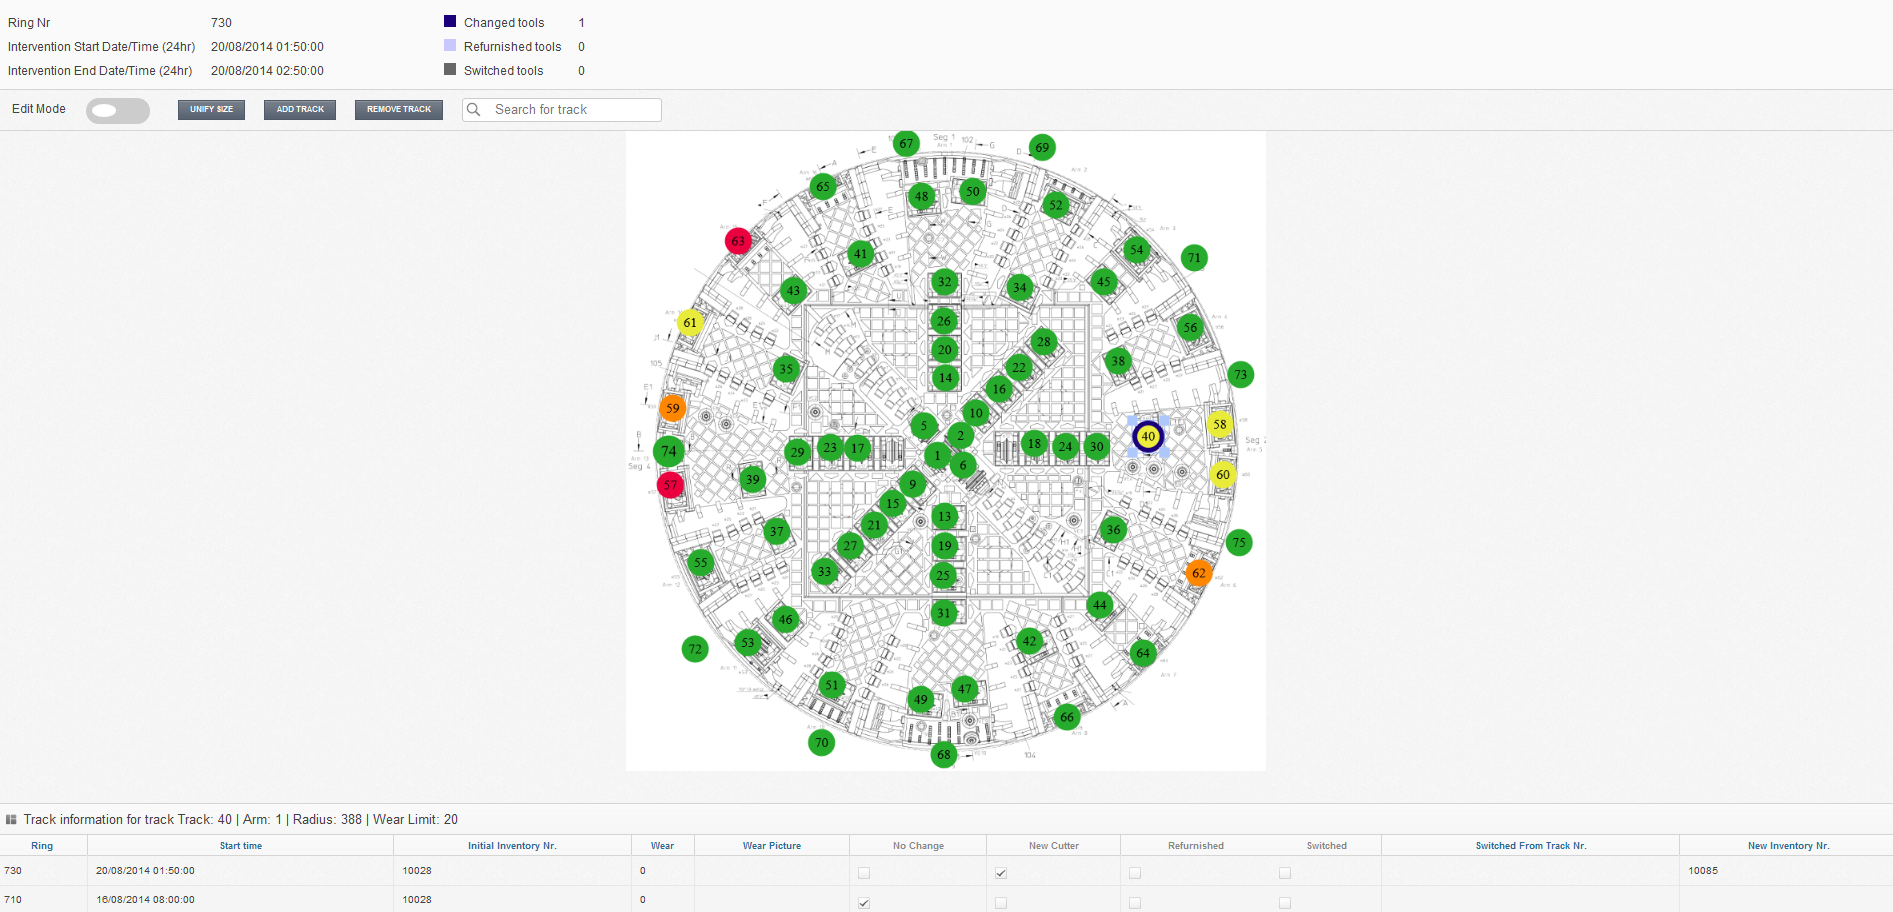 |
Track overviewThe condition of the installed cutter tools is visually provided. The current wear of the installed tools is represented by different colors. Additionally, those tracks are highlighted on which a tool has been exchanged, refurnished or switched. When displaying the tracks of the discs an overview of the number of already changed tools is shown on the right of the cutter image. The status of the tool condition can be presented for each intervention. Furthermore, by selecting a specific track the history of this track is provided in a table beneath the cutter image.
|
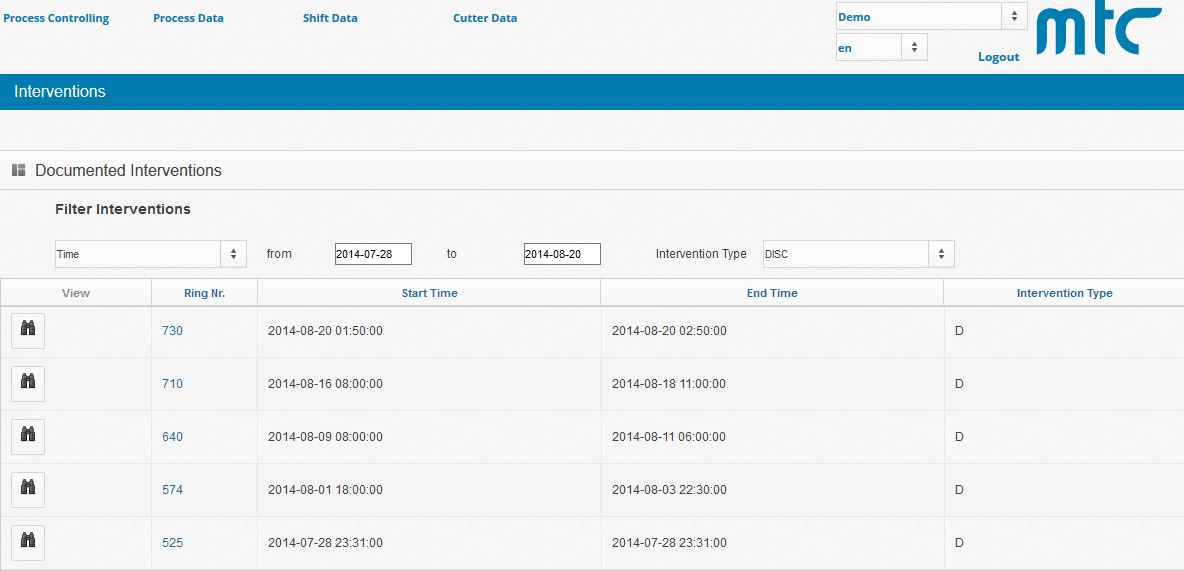
Intervention listAll documented interventions are shown in a list with shortcuts to their containing data. The interventions can be filtered by several criteria to easily identify the required intervention. An intervention can be exported to a customized PDF report for a holistic documentation of the intervention. This list can also easily be added to a dashboard to generate a custom software structure.
|
 |
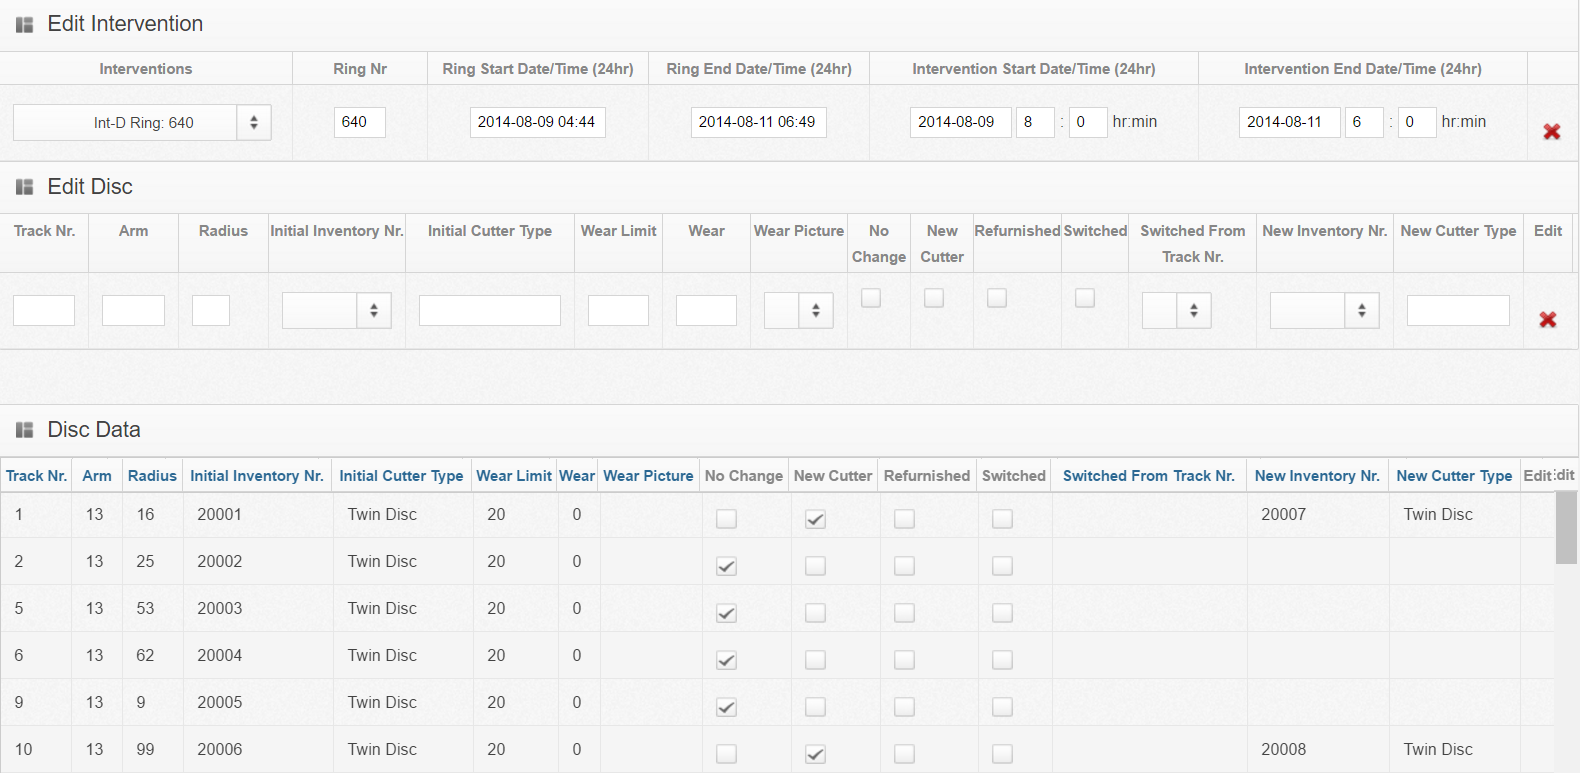 |
Intervention configurationFor entering a new tool change, an intervention either has to be created or an existing one edited. Each intervention is assigned to a ring during which it was performed. When a tool change or another action on a tool shall be documented, the tool has to be selected and the information can be assigned. In addition to usual information like the current wear of the tool also the reason for a tool change the so called wear picture can be specified. When you open the page in the demo project, please select an intervention (under the headline of "Edit Intervention") to see some data.
|
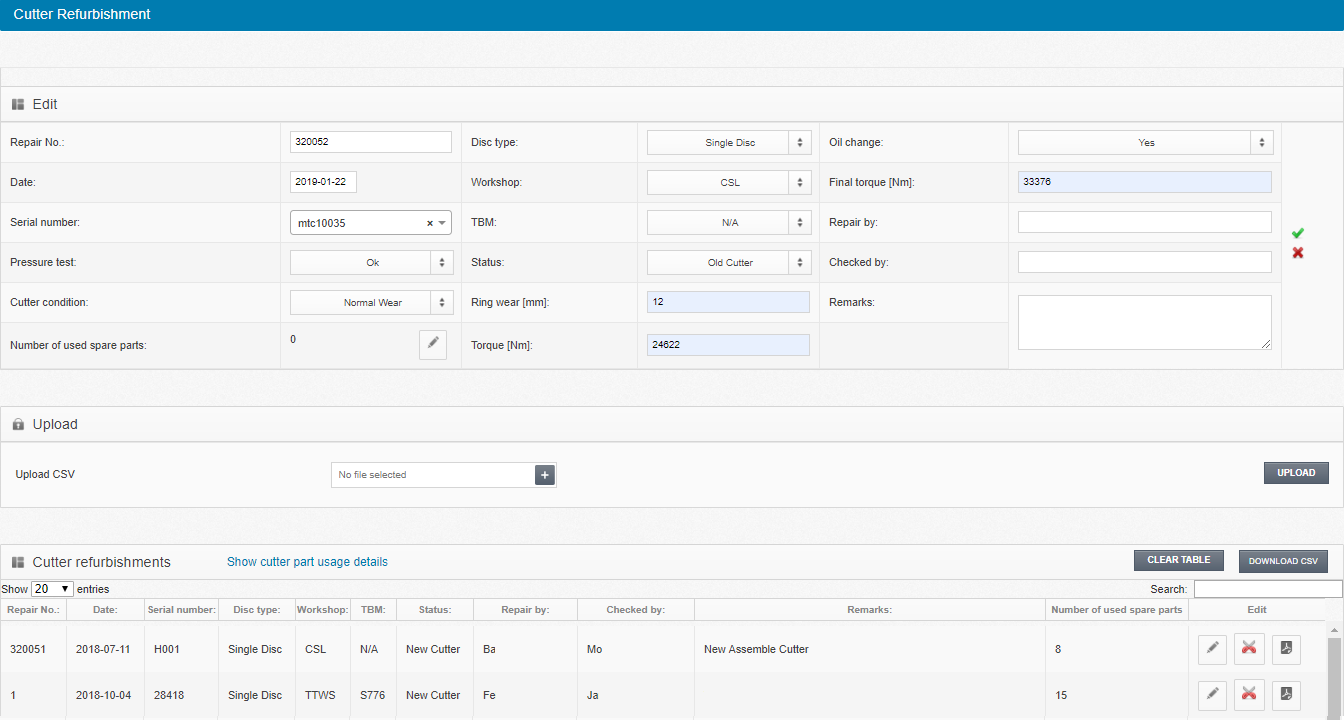
Cutter refurbishmentFor the documentation of the repair of the disassembeled tools, PROCON provides a page to enter the data gathered during the repair in the workshop. Based on this data, a PDF report can be generated fow a holistic documentation. In a pop-up a listed overview is provided over the available refurbishment parts.
|
 |
Monitoring
In an integrated additional database, monitoring data is stored
that is retrieved from arbitrary instruments registered in the
PROCON II data warehouse. Here, an instrument consists of a
number of data series which contain the individual data. For each
instrument the position and its assignment to a specific class of
instrument (e.g. extensometers or leveling points) is captured.
The data series contain additional information regarding their
assignment to a monitoring section and their warning and alarm
levels which can then be applied to determine the status of the
instrument. Using this information, the location and the time of
measurement of each data entry is connected with the project
reference system.
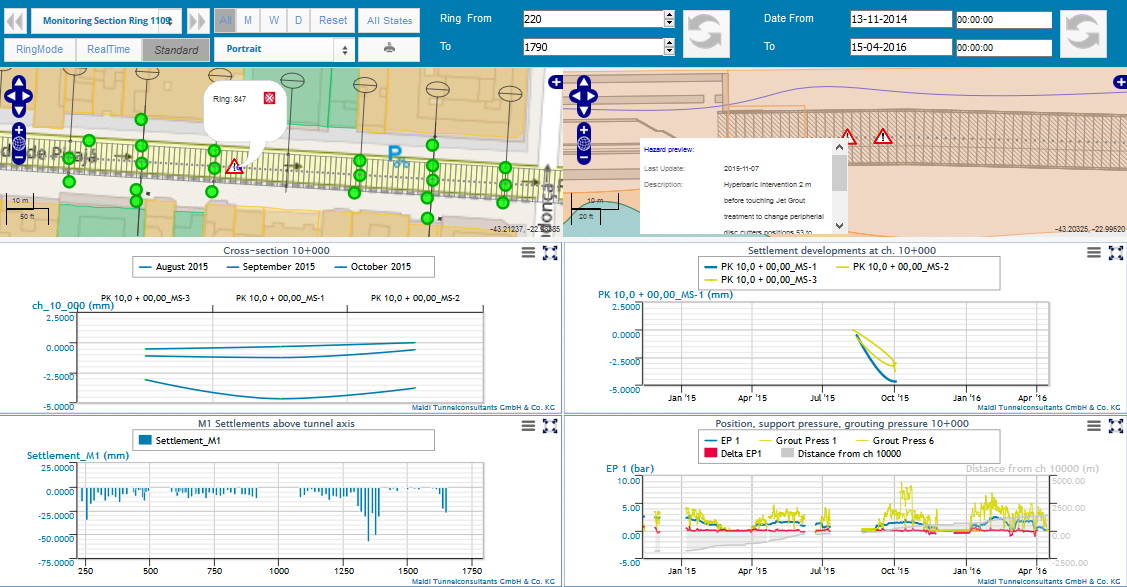
This allows specific visualization
options for monitoring data. The development of settlement
troughs, for example, can by shown by visualizing monitoring
cross-sections.
SettlementsThe monitoring data module provides several features for displaying settlement data and other monitoring data in an interactive environment. Some of these features are listed below:
|
 |
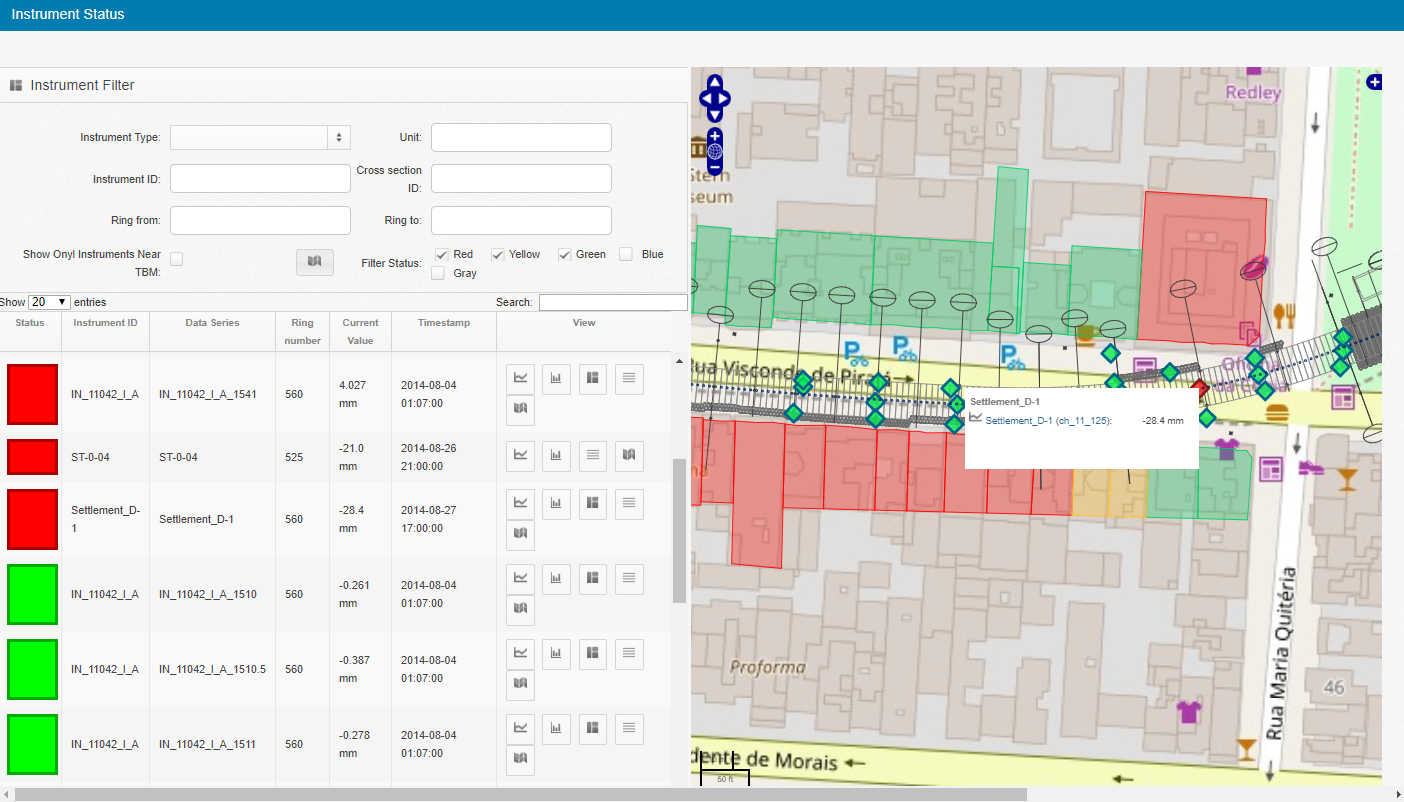 |
Instrument monitoringTo monitor the status of the individual instruments, PROCON provides a page where instruments are listed in a table as well as shown on map. The table and map are linked so that only those instruments listed in the table are visible on the map. The content of the table can be individually defined applying several filters like the instrument type or the status of the instrument. Another filter shows only those instrument in the table which are located near the current position of the TBM in order to rapidly list and access those instruments in the area of influence of the tunnel excavation works. By default, the instruments in the table are sorted by their status so that the most critical instruments are always shown first. For monitoring an instrument more closely, several chart options are provided for openening a standard chart, shield passing chart or cross section chart. Additionally, data of the corresponding instrument can be checked in a data table popup.
|
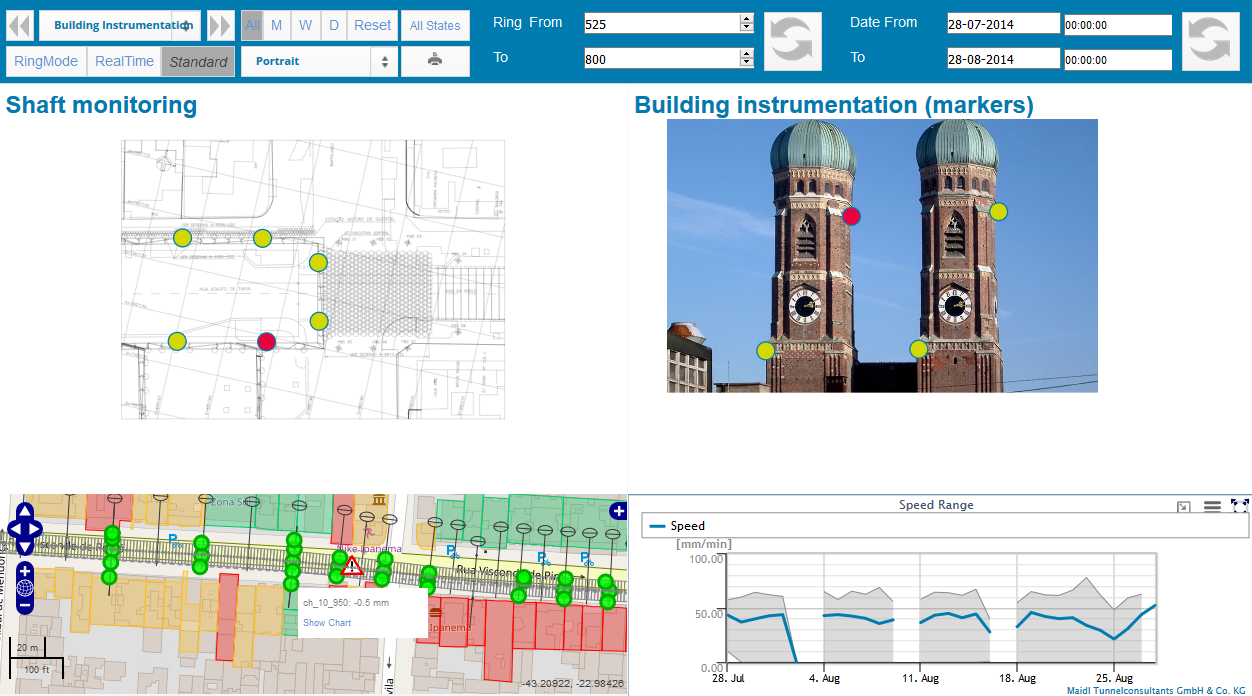
Site monitoringDuring a tunneling project some buildings are highly sensitive and have to be monitored very closely. In PROCON for these building individual dashboards can be created which contain structural images where installed monitoring sensors have been marked. By clicking on the marker, a chart pops up and displays the data of the sensor. Thus, the user can very fast and easily inform himself about the status of corresponding building.
|
 |
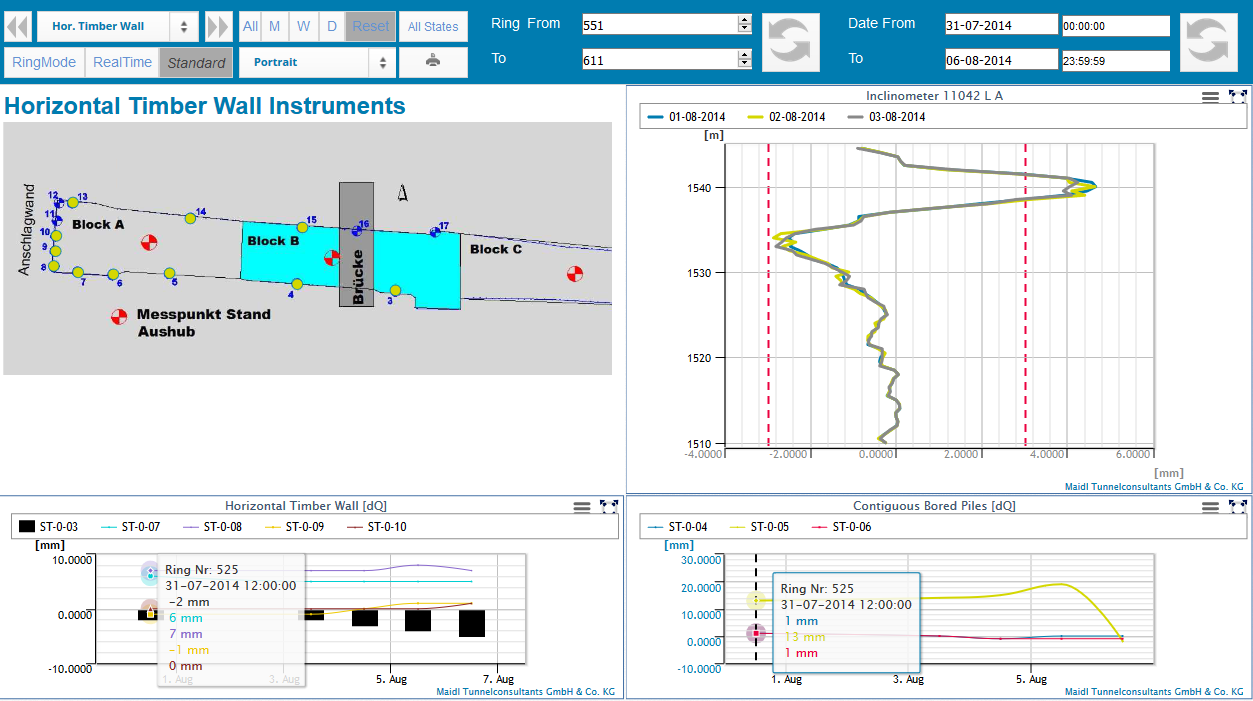 |
Horizontal timber wallAll aspects of a tunneling project can be captured with PROCON as well as the monitoring of the construction pit. The arrangement of the individual sensors can be shown on a specific plot where each captured sensor can be clicked to show its sensor values in a chart. Some corresponding charts of the monitored area can be arranged on the same dashboard to get a quick overview.
|
Reporting
The documentation of the tunneling process is essential due to
many aspects. Therefore, Procon II offers custom-designed machine
data reports, intervention reports and shift protocols as
printable reports to document the progress. Upon setup of the
project, MTC considers the project-specific requirements and
prepares automatically updating report templates via the web
interface. Reporting periods and various filter functions can be
arbitrarily selected.
The reports can be arranged in
dashboards to allow for adjustments of reporting periods and to
add manual annotations before downloadind and printing them.
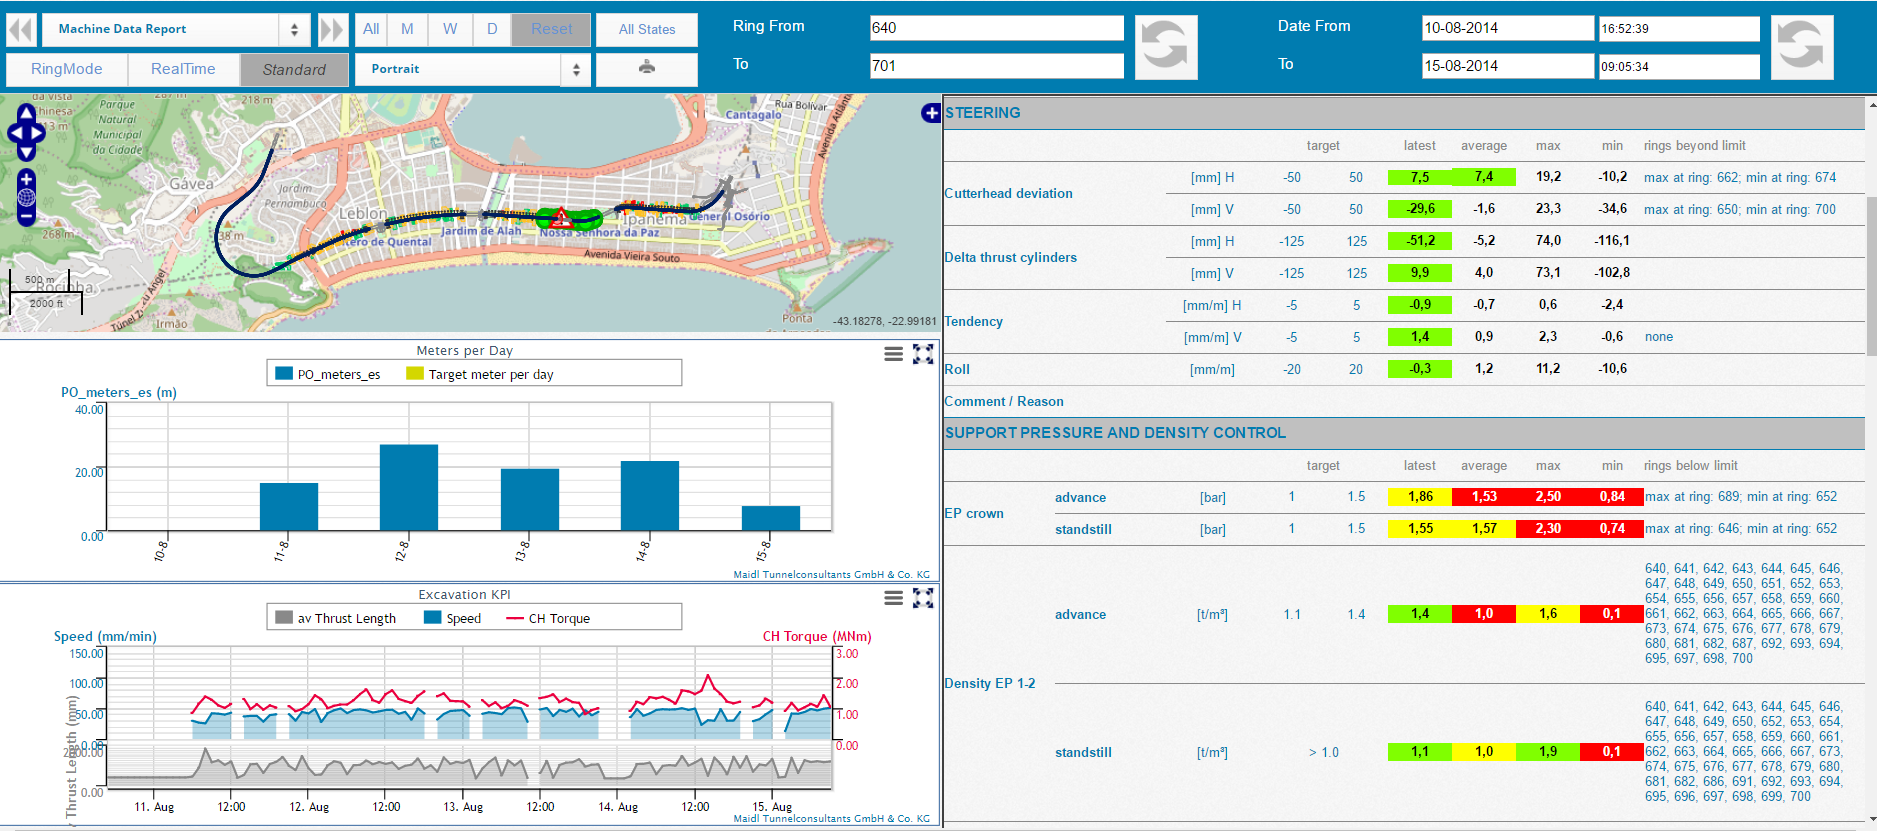
Machine Data ReportSpecial customized reports containing different, selected machine parameters are provided by MTC. They are filled with data for the selected range in the dashboard and offer a download functionality such that they can be printed and signed. As usual, these reports can be displayed on dashboards in the context of additional data visualisations, thus allowing for further in-place evaluations.
|
 |
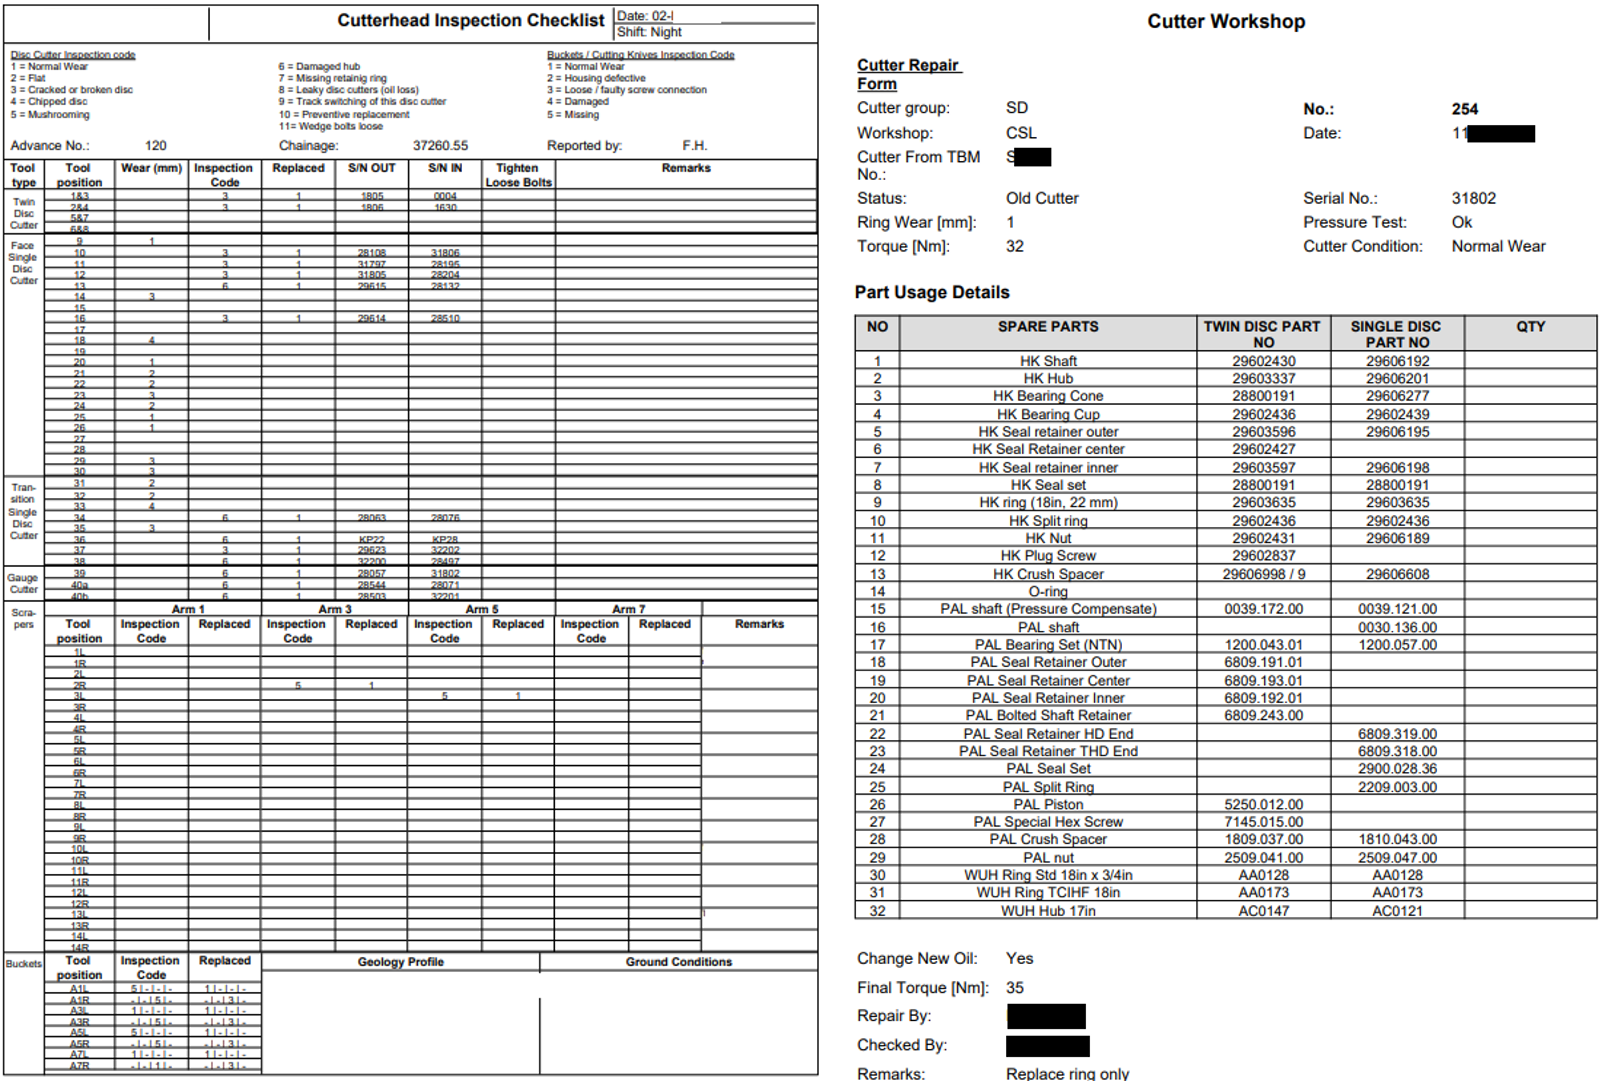 |
Tool Management ReportsWith PROCON II you are well equipped for the documentation of the tool management process. Individual, customized reports are provided for managing and documenting the performed interventions and exchanged tools. Additionally, reports are provided for the documentation of the tool repair process in the cutter workshops. |
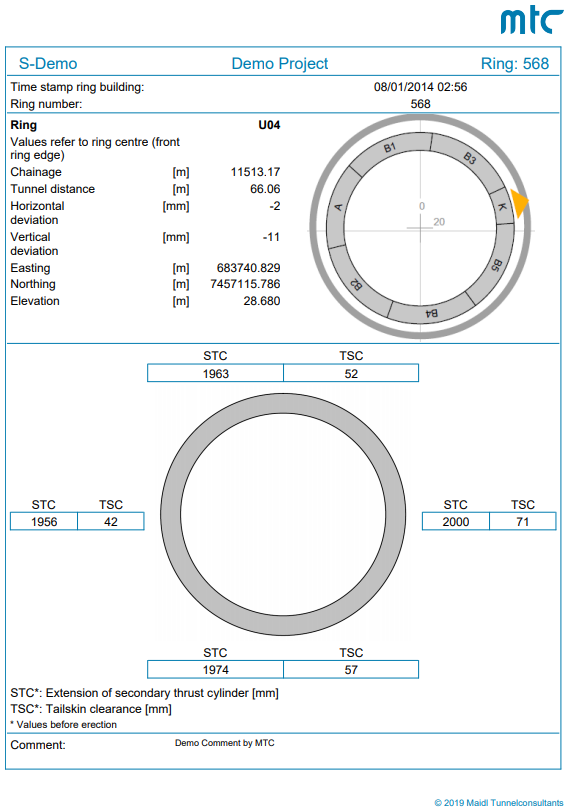
Ring Building ReportAnother PROCON II report is the ring building report for the documentation of the ring building process. The report is automatically generated based provided data like the ring rotation. Additionally, it can be further refined by customized comments. The final report can be downloaded as PDF.
|
 |
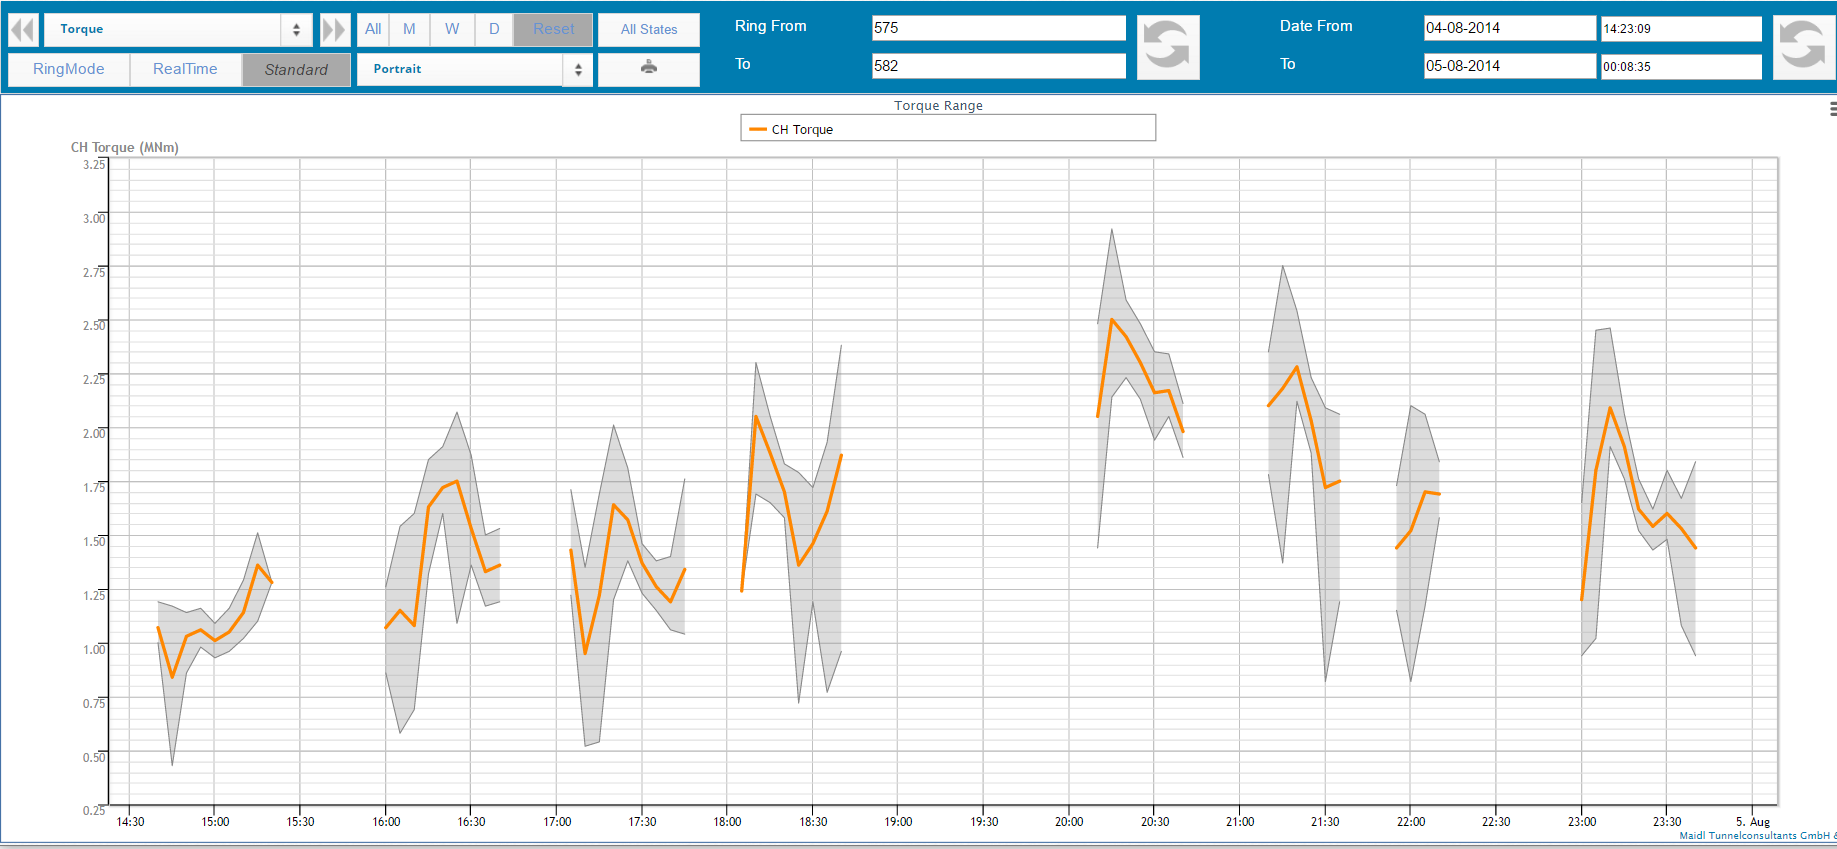 |
Example: torque chartSingle charts can be generated for the reporting so that they can be exported as PDF or image and attached to your documentation report.
|
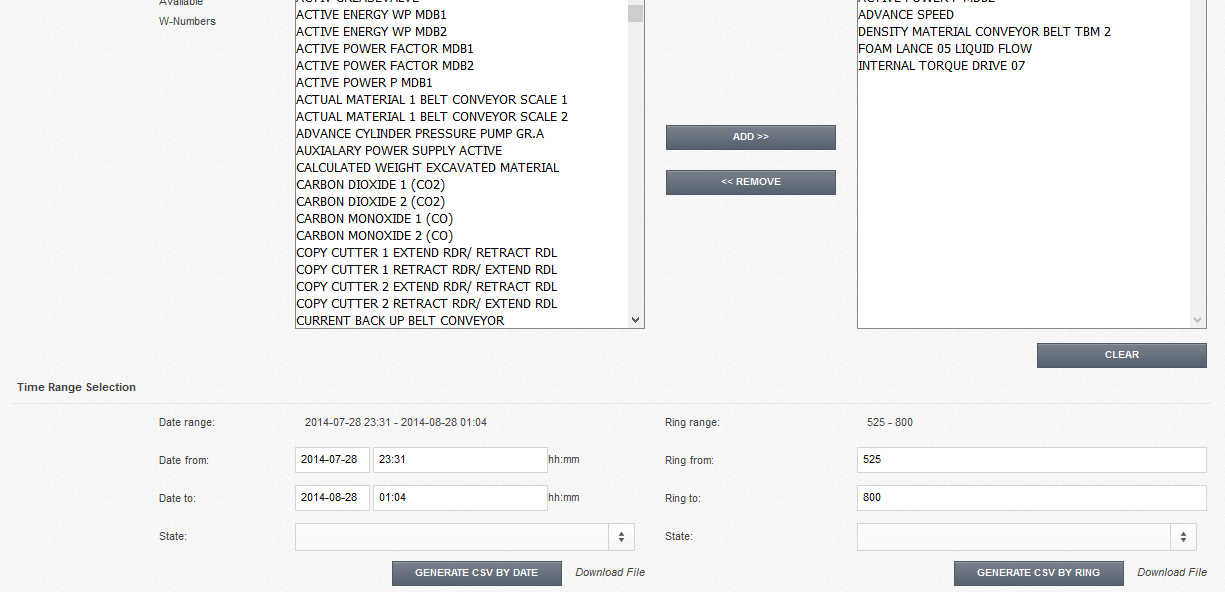
CSV exportFor further specialized processing of the recorded data, selected data can be exported in CSV format. This can be either TBM data, entered downtimes or monitoring data. The required data series or downtimes can be easily selected and stored in a template for a quick reuse, so that for each download only the time range has to be specified.
|
 |
Segment Tracking
Segment Tracking describes the consistent tracking of produced
segments throughout their life cycle. This process includes the
production of the segments, their temporary storage on the
construction site, their installation as part of a tunnel ring
and their health status both during construction and operation of
the tunnel. The segments are tracked by applying labels with
codes on each segment.
Maidl Tunnelconsultants offer segment
tracking services in cooperation with a well-experienced partner
company, who provides the workflow implementation as well as all
required hardware including handheld devices for entering the
current information of the corresponding segments and a server
which stores all the collected information and transfers it to
the PROCON server. Thus, segment tracking information is
available and accessible through PROCON at any time.
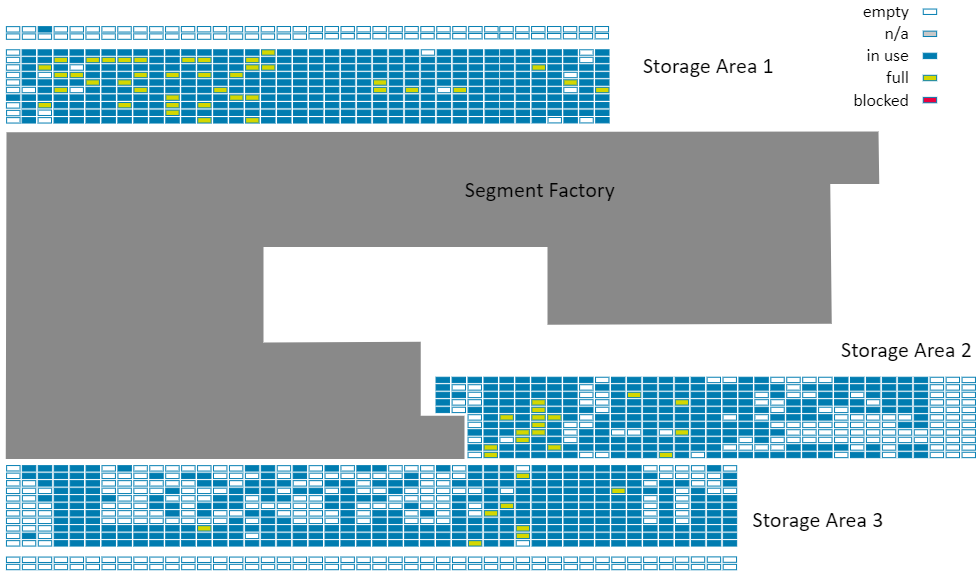
Segment StorageTo always be informed about the current condition of the segment storage area, PROCON provides a dashboard where all storage spaces are visualized including their current status. By highlighting the individual storage spaces in different colors, it can be easily identified which spaces are empty, in use or full. The arrangement of the storage spaces is customized for each project. By clicking on one storage space, the stored segments on this space are shown.
|
 |
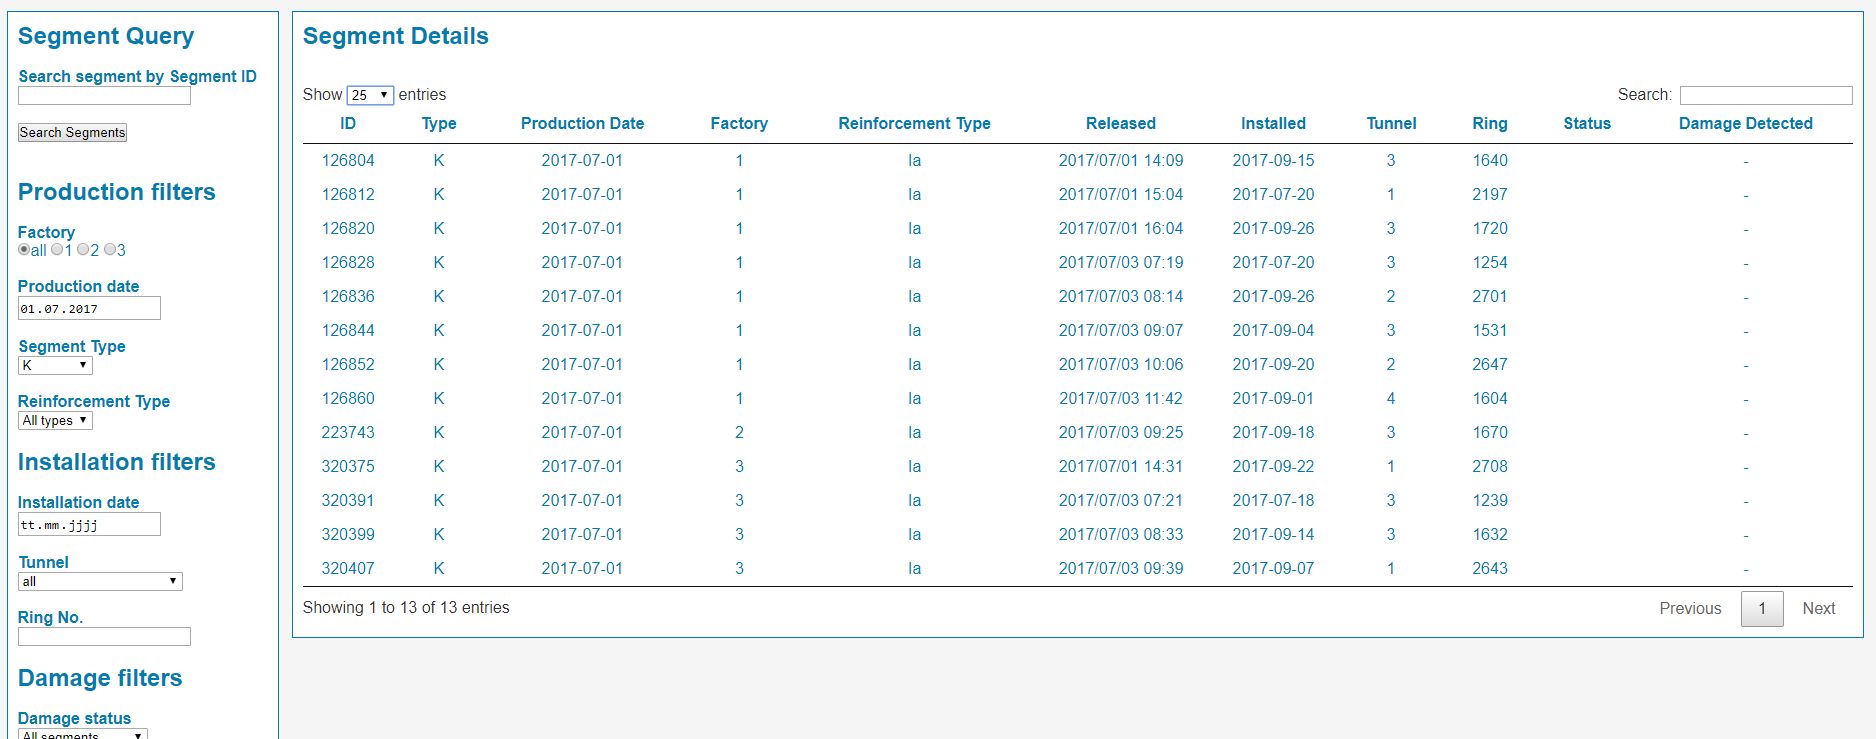 |
Segement QueryTo get detailed information on the existing segments, PROCON provides a query service where the segment database can be searched. To easily identify the required segments, filters can be applied which filter the available segments, for example, by the production date, installation date, installed tunnel ring, segment type or reinforcement type. The identified segments are provided in a list. By clicking on the corresponding segment id, the PDF report to the corresponding segment can be downloaded.
|
Ring-based information
In many cases, you may want to add location-based and
process-related additional information. These can be (ranges of)
target values for operational parameters such as the support
pressures. But also external measurements and evaluations such as
ground water levels, information on site logistics, or ground
conditions can be easily acquired on a by-ring basis.
PROCON II enables you to add this data in an arbitrary structure
by means of user-defined processes and definition of respective
data types. These data can be arbitrarily visualized and
combined with machine and monitoring data on Procon's dashboards.
Damage of lining segments is not only possible during production
or in the storage, but also during transport and installation in
the tunnel. It is crucial for quality control to securely
document all damages and to track repair works.
PROCON II
includes an intuitive tool to enter and manage ring damages. Additionally, the
entered damages can be summarized in a PDF report for further
documentation.
CategoryA category of processes is defined along with their type. This type can be a number, a date or a text. These categories capture individual processes which represent the same aspect, for example, earth pressure target values.
|
 |
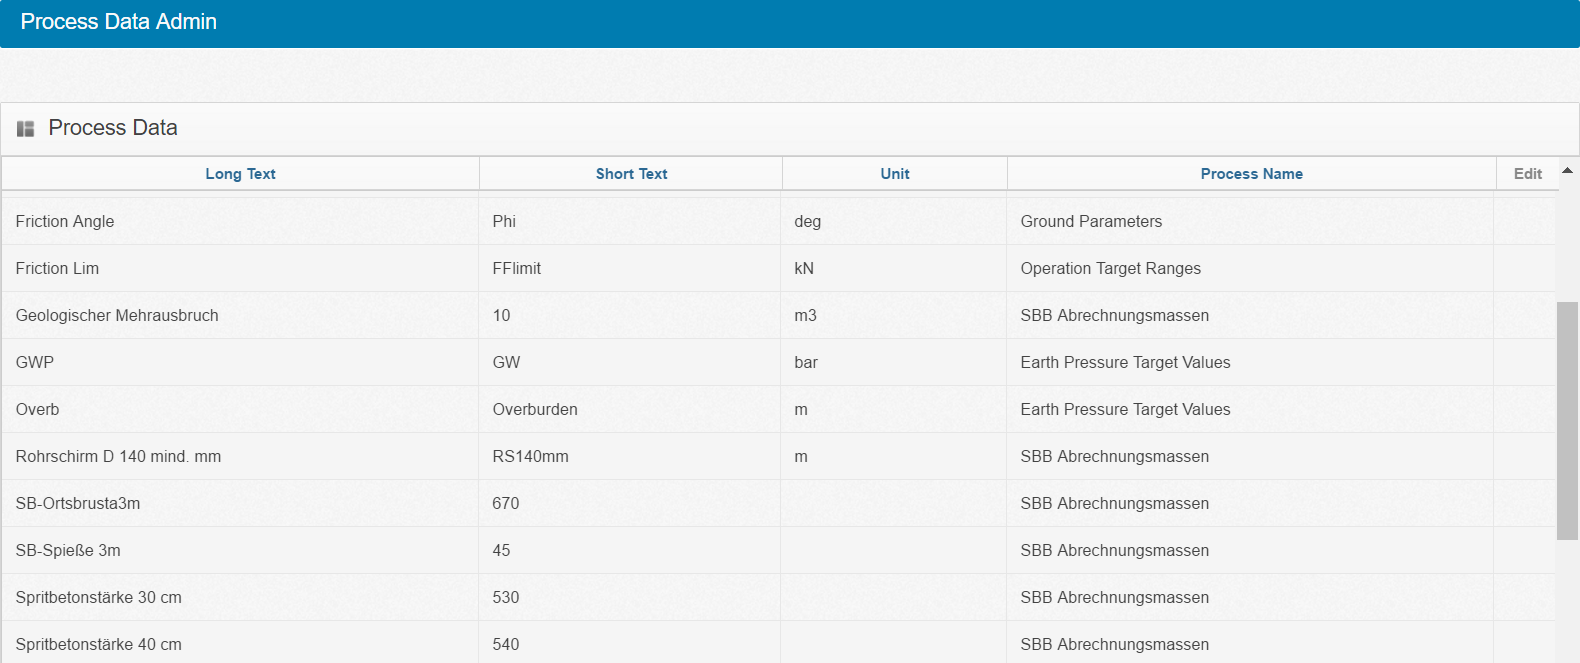 |
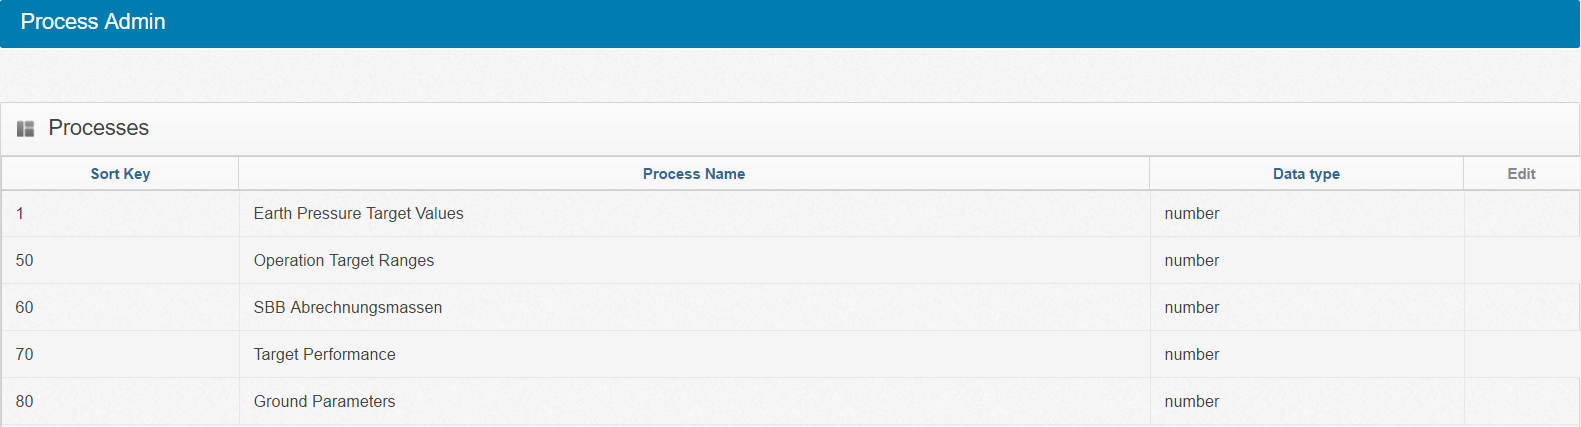
ProcessHere, the individual processes are defined, for example, “Upper pressure limit of earth pressure sensor 1”. For defining a process, a name and a unit must be specified as well as the category to which the value is assigned.
|
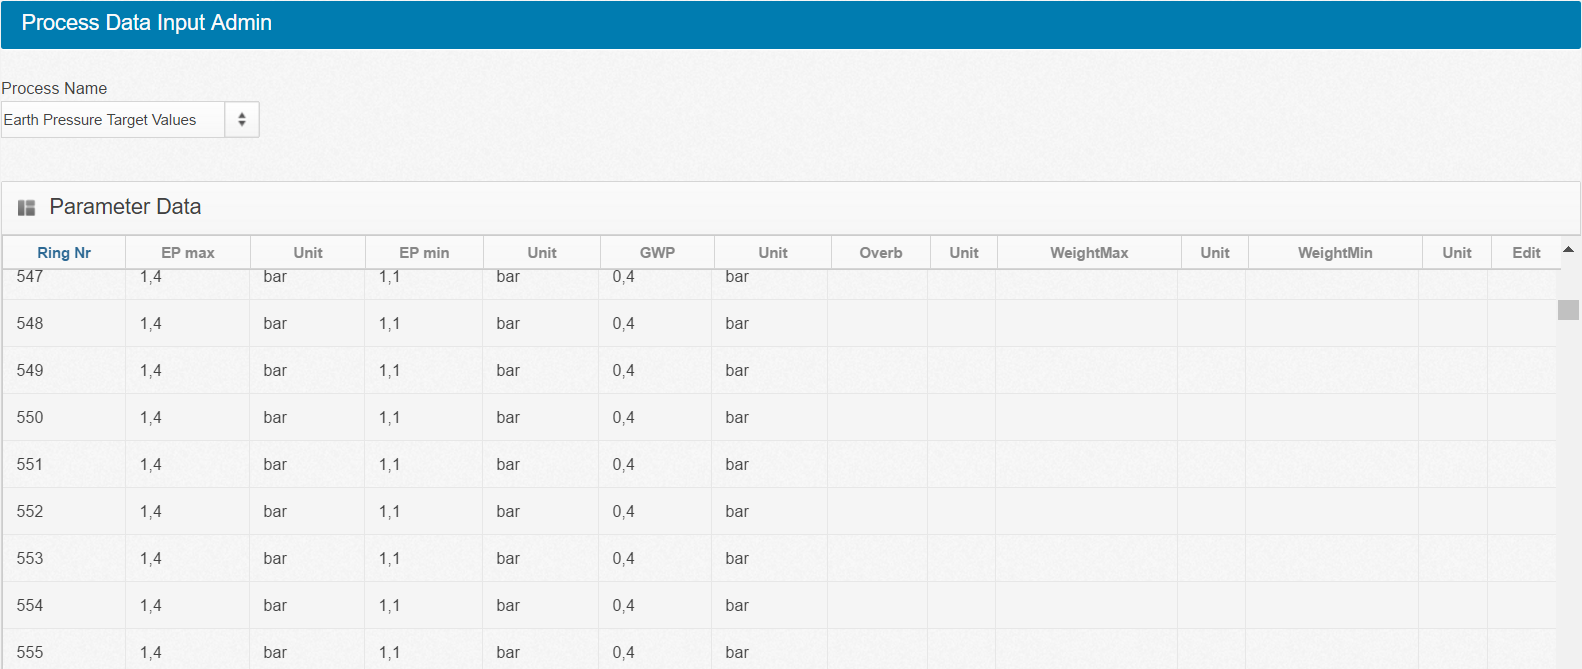
DataIn the "Process Data" the values for the configured target values and ranges are entered. These values habe to be provided for each ring. To reduce the work, the data can be prepared in an excel sheet beforehand and imported into PROCON using CSV files. |
 |
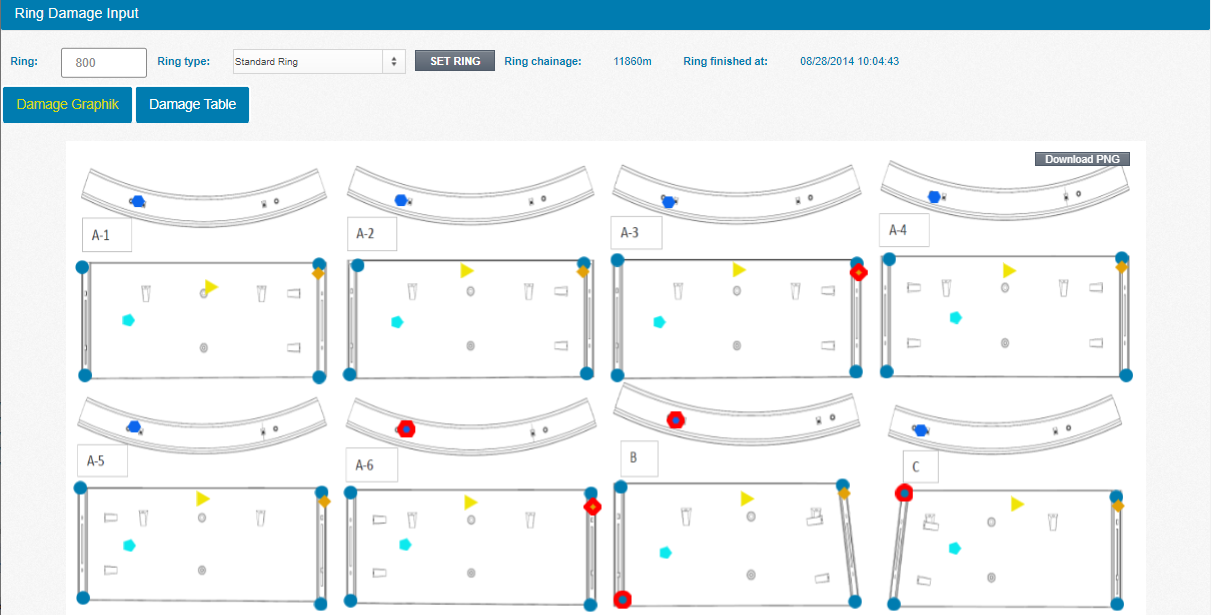 |
Ring damage documentationDamage of lining segments is not only possible during production or in the storage, but also during transport and installation in the tunnel. It is crucial for quality control to securely document all damages and to track repair works. PROCON II provides an in-built service to easily track damaged segments. By means of a dedicated input panel in PROCON II or via an interactive graphical representation of rings and their segments, damages can be classified and documented. Their repair status is tracked along the complete workflow. All information gathered in the segment damage tracking can be exported in terms of PDF reports.
|
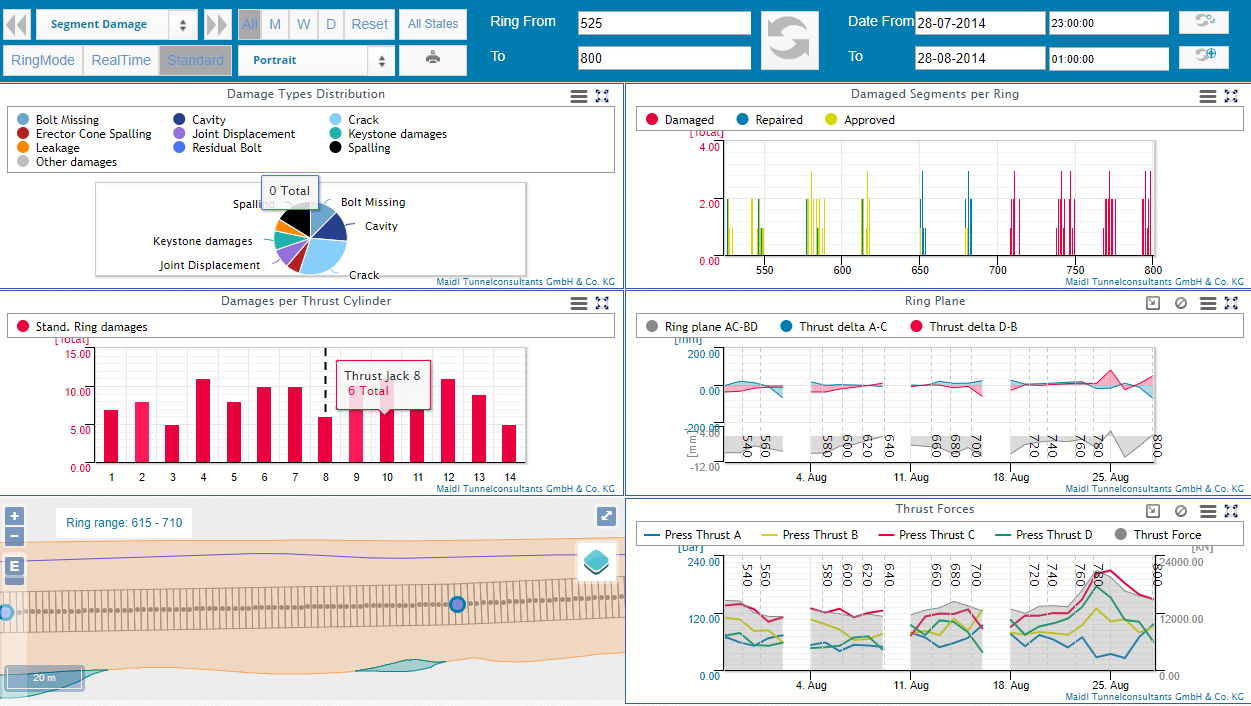
Ring Damage EvaluationPROCON's typical visualisation and analysis tools are available for segment damages, helping to chase damage patterns or quality issues. Evaluations can be generated, for example, based on the ring type, segment, damage type or thrust jack position. The generated evaluation charts can be combined on dashboards with geological data, TBM, data, etc. to easily find correlations between the data sources. |
 |
Mobile View
Often you are on the move and you have no possibilities to monitor the current status of the project at a computer. Therefore, PROCON II offers a mobile version which can access customized dashboards via smartphone or tablet to monitor different aspects of the project to quickly react in case of problems. You can easily reach the mobile version using the browser of your device and the known URL.
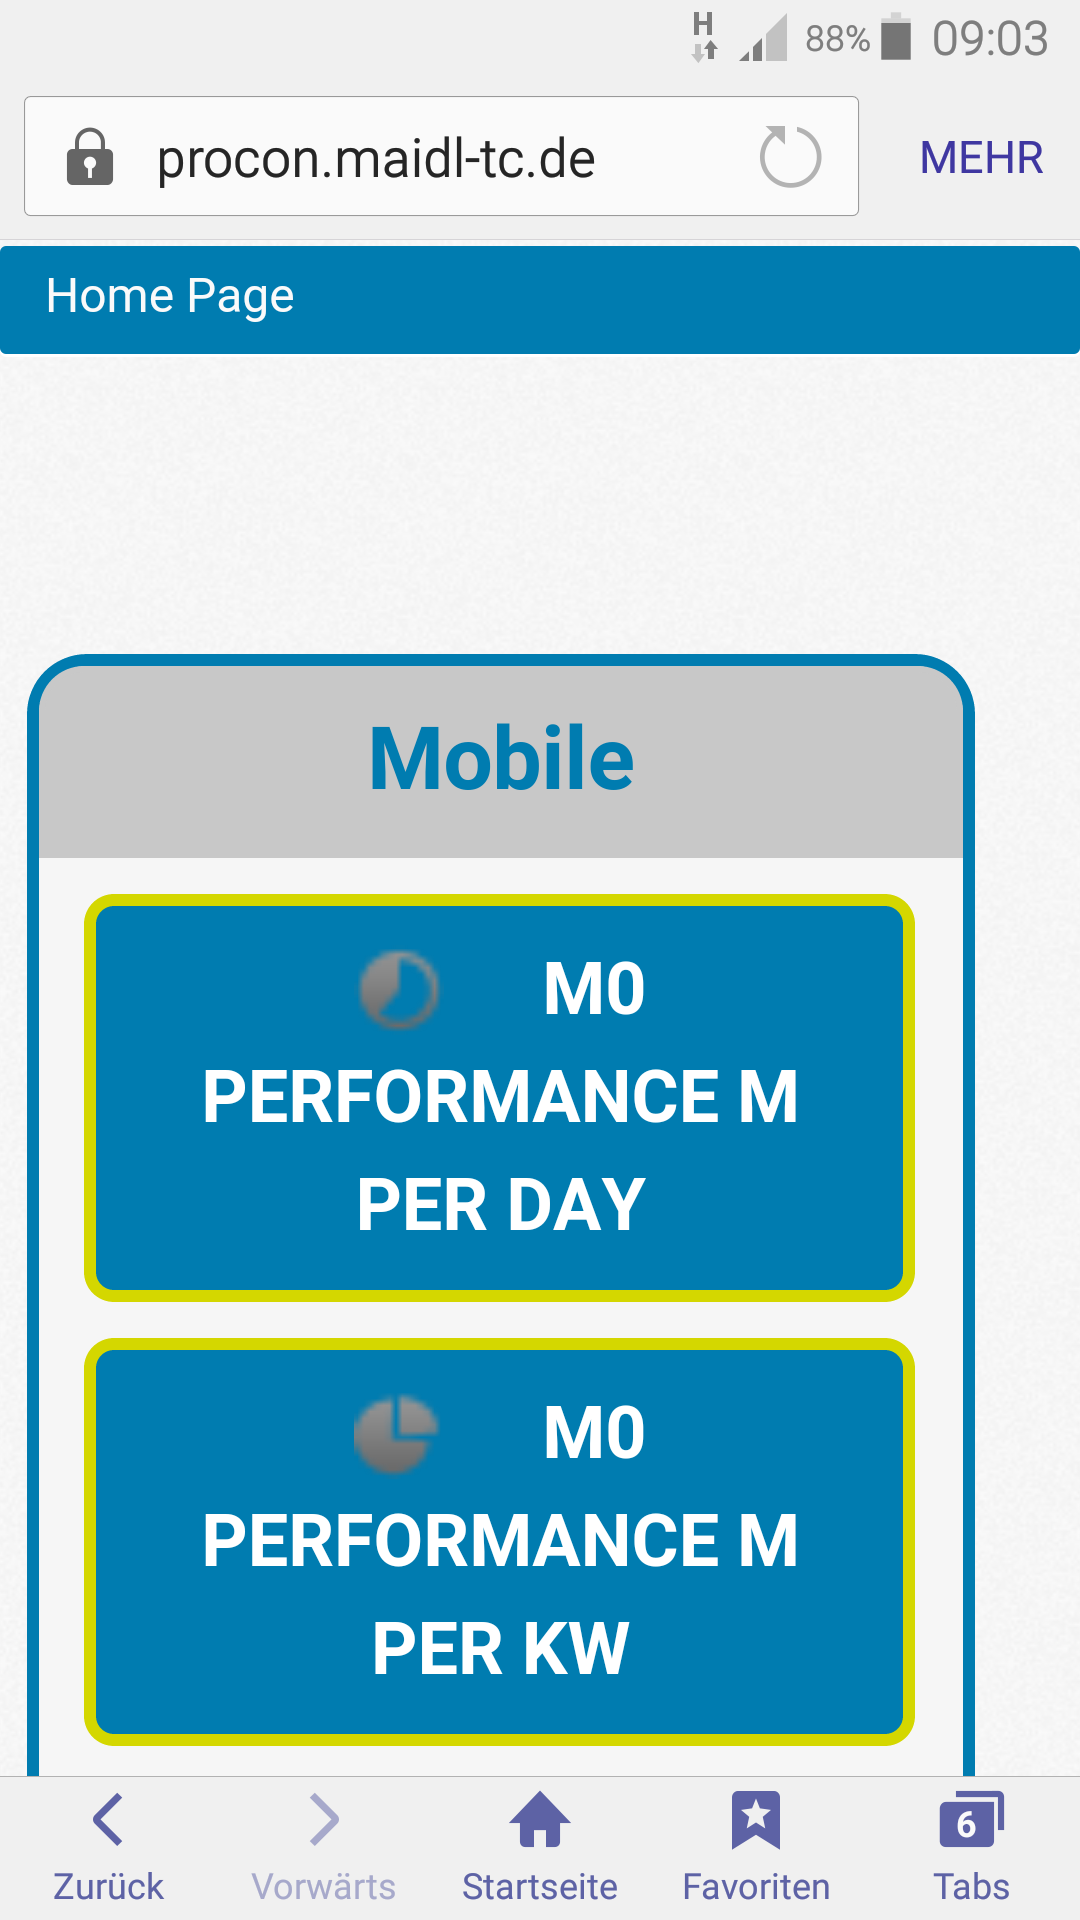 |
Mobile NavigationAfter your PROCON II login you reach the start page. Here, all dashboards of the mobile version are listed and you can quickly navigate to the required data. However, the dashboards of the mobile version are only shown on the start page of the mobile version. In case of a tablet, dashboards of all categories are listed, mobile or not.
|
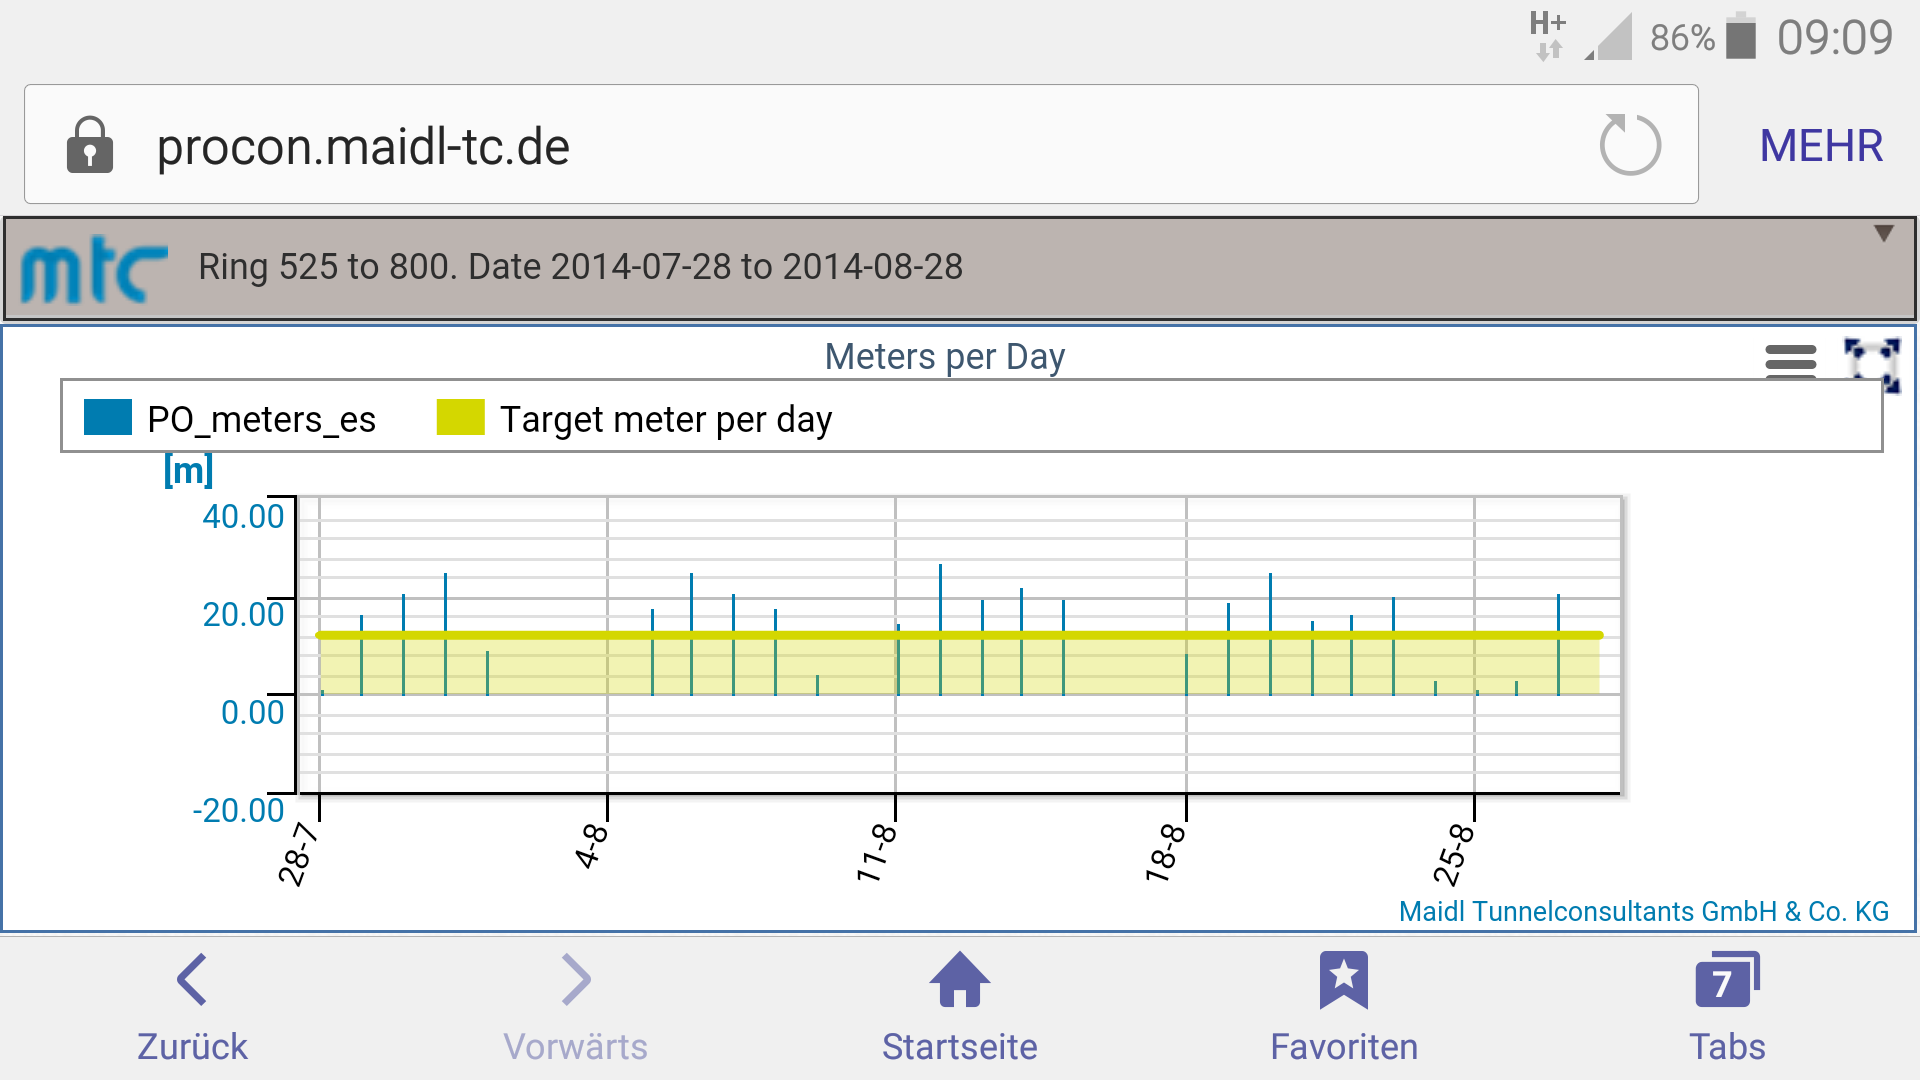
Performance ViewFor the mobile version you can create individual dashboards which contain all data you require while you are on the move. The example displayed in the figure shows the daily performance of the project. Of course, you can create dashboards which show the current thrust forces or grout injection quantity to be always informed of the current status. |
 |
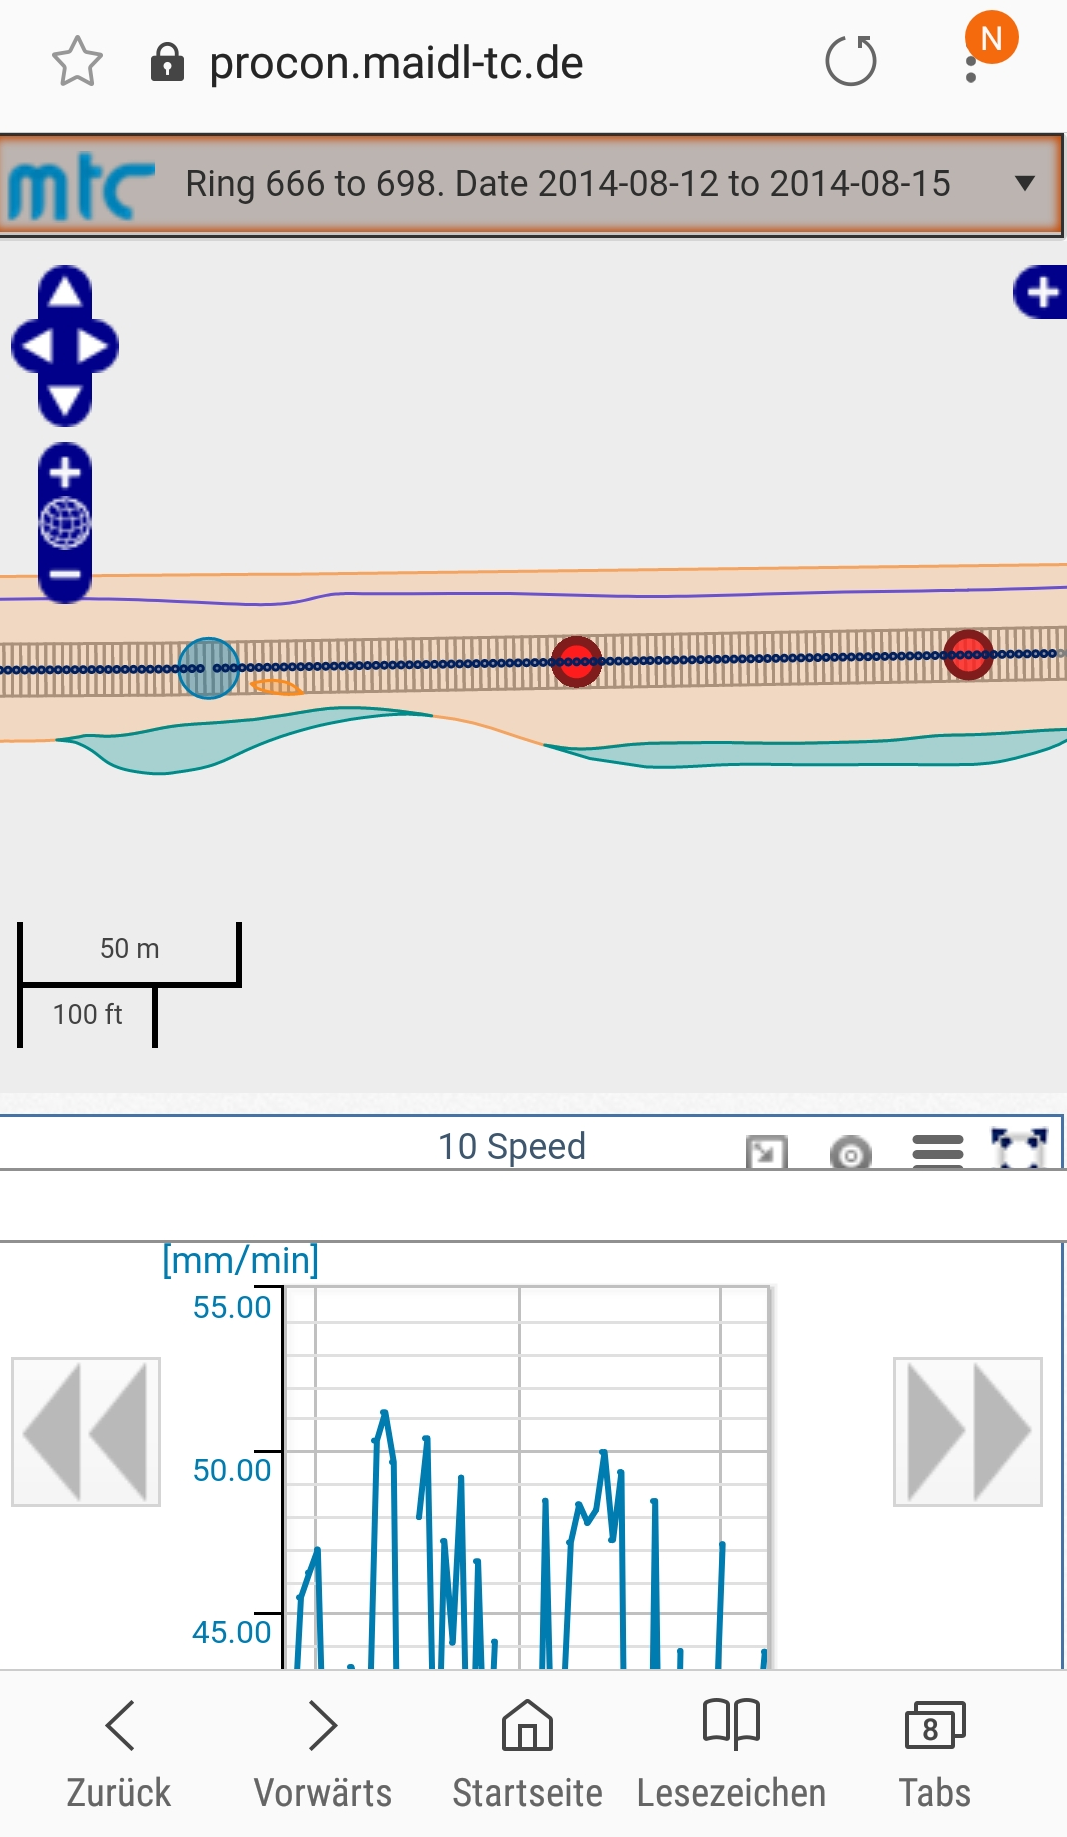 |
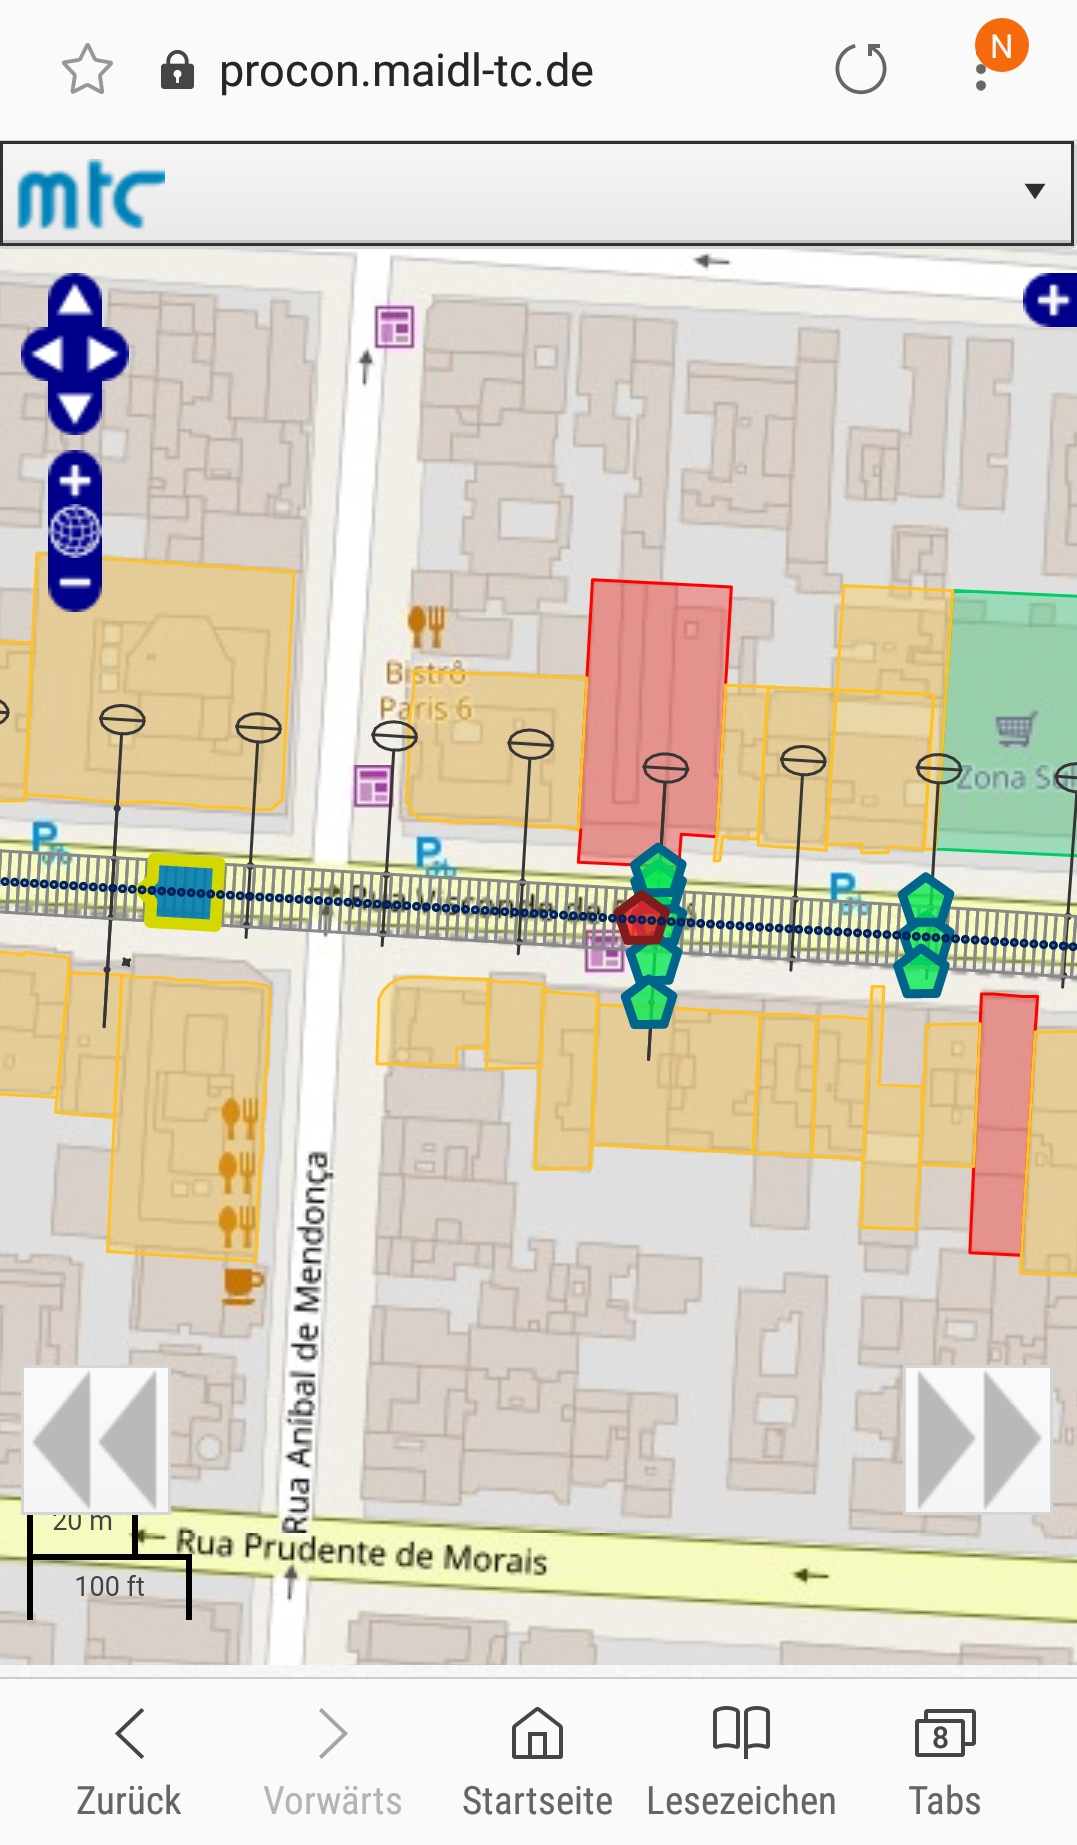
Map and Ground ViewFollow the current position of the machine on your mobile device. In the mobile view as in the normal view you can monitor the machine in a GIS environment alongside with machine and monitoring data. The GIS environment can be represented by a map as well as a geological longitudinal section.
|
Integration with BIM
BIM can be employed at an early stage of the tunnel project and used already to advantage in the design and construction phases. The key components of these models can be linked to each other by means of a common location and time reference framework.
3D tunnel model
The tunnel model consists of the individual segmental linings representing the tunnel tubes. Each tunnel tube contains a number of rings consisting of a defined number of individual segments. Each digital segment has assigned various information from the start like its segment type or its ring number. During the tunnel advance, the information of the segments increases steadily by the incorporation of data from segment tracking and quality management, document linkage or highlighting of the TBM data history (e.g. thrust forces). An easily navigable visualization of the segmented lining allows a quick data identification, problem evaluation and overview of the projects progress.
3D ground model
The purpose of a digital ground model is to provide information
from geotechnical investigation and geological expertise to all
project stakeholders in a computer-readable form.
Incorporating
a 3D ground model into the day-to-day project assessment provides
target-actual comparisons of ground conditions and disposal
masses, the verification of operation parameters and consumption
records as well as conservation of evidence.
The ground
model consists of numerous closed shells representing the
individual ground layers. Each layer has assigned its geological
properties. The volume of the 3D tunnel model is cut out from the
3D ground model. Along its alignment, the tunnel volume is
intersected with the digital ground model to create a digital 3D
tunnel model with areas of similar geotechnical properties.
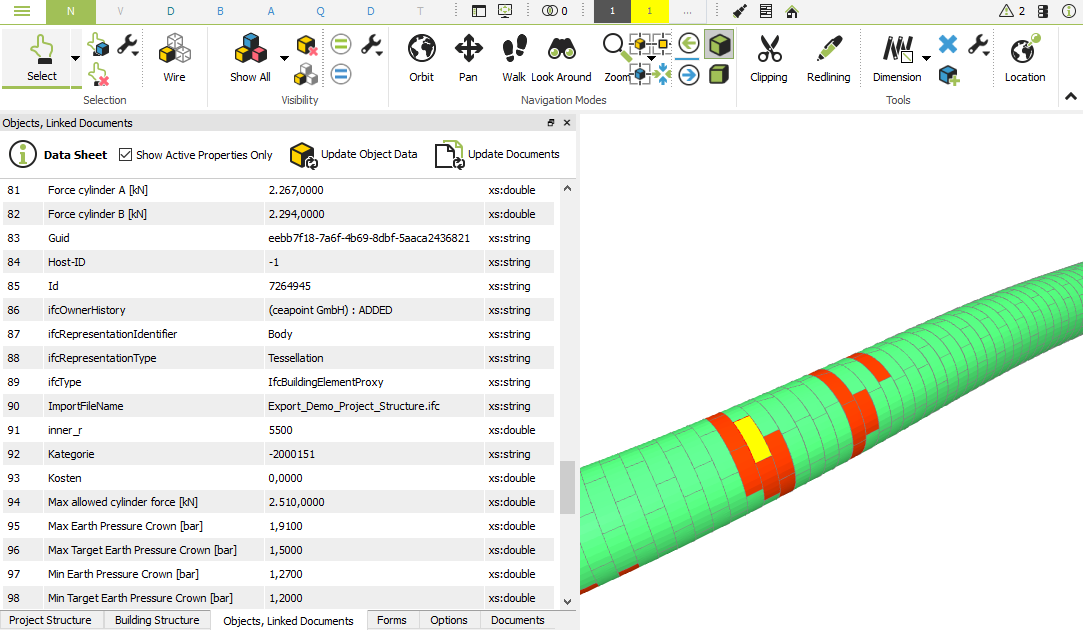 |
Integeration of TBM and monitoring data in PROCONThe integration of data from PROCON or other data sources into the BIM model is implemented by applying the DESITE MD software which contains an integrated JavaScript API. DESITE MD is a very powerful BIM Viewer software which can be used for BIM model evaluations like volume evaluations or collision checks. Its Javascript API is applied to extract data via the REST interface of PROCON and link it with its corresponding digital representation in the BIM model. This data can be TBM data like sensor information, monitoring data or even document data. Containing all relevant information, the BIM model can be applied for the generation of simulation models. The extraction of required parameters for the analysis of ground/surface deformations including TBM operation parameters enable an easy setup of simulation models with direct comparison of predicted vs. actual settlements. |
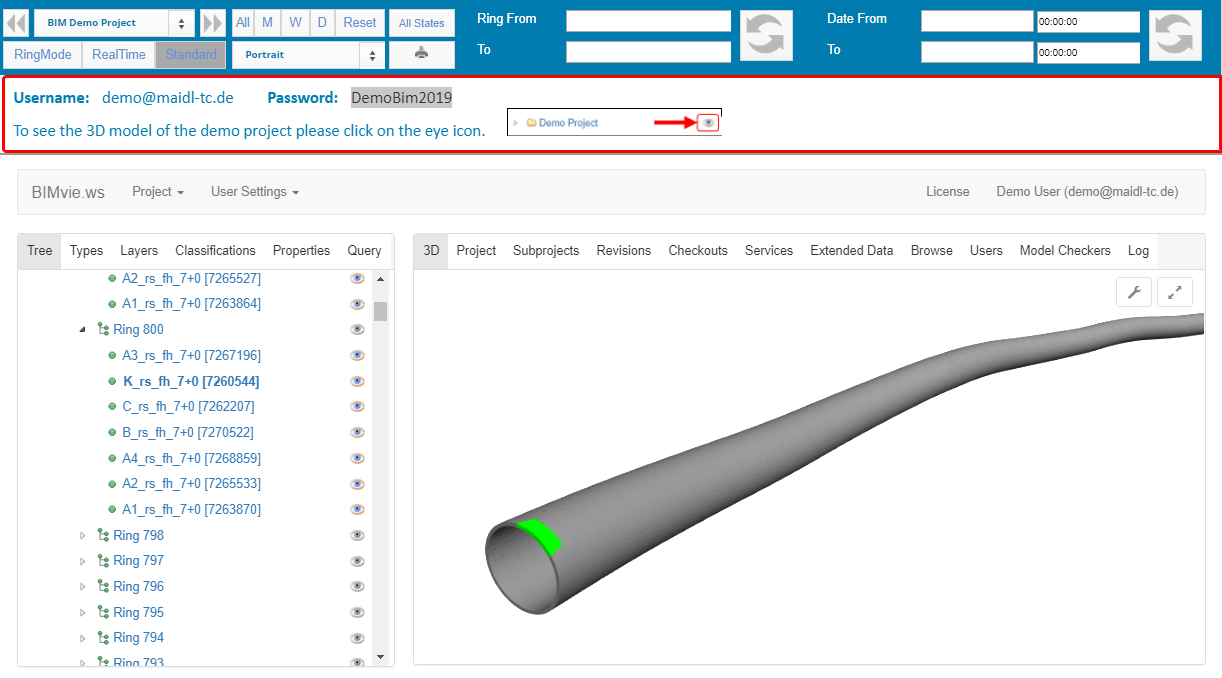
Integrated BIM Viewer in PROCONAs described the management of the BIM model is performed in the Desite MD software. However, for data evaluation and data monitoring a simple BIM viewer can also be applied, which visualizes the existing models and displays the linked information. Therefore, PROCON has integrated a web-based BIM viewer in which the current BIM model of the demo project has been uploaded. Evaluations on the BIM model can also be performed here. Thus, the BIM model is also made available to PROCON users who do not have a Desite MD license. To visualize the 3D BIM model, click on the eye behind the project name.
|
 |
