In an integrated additional database, monitoring data is stored
that is retrieved from arbitrary instruments registered in the
PROCON II data warehouse. Here, an instrument consists of a
number of data series which contain the individual data. For each
instrument the position and its assignment to a specific class of
instrument (e.g. extensometers or leveling points) is captured.
The data series contain additional information regarding their
assignment to a monitoring section and their warning and alarm
levels which can then be applied to determine the status of the
instrument. Using this information, the location and the time of
measurement of each data entry is connected with the project
reference system.
This allows specific visualization
options for monitoring data. The development of settlement
troughs, for example, can by shown by visualizing monitoring
cross-sections.
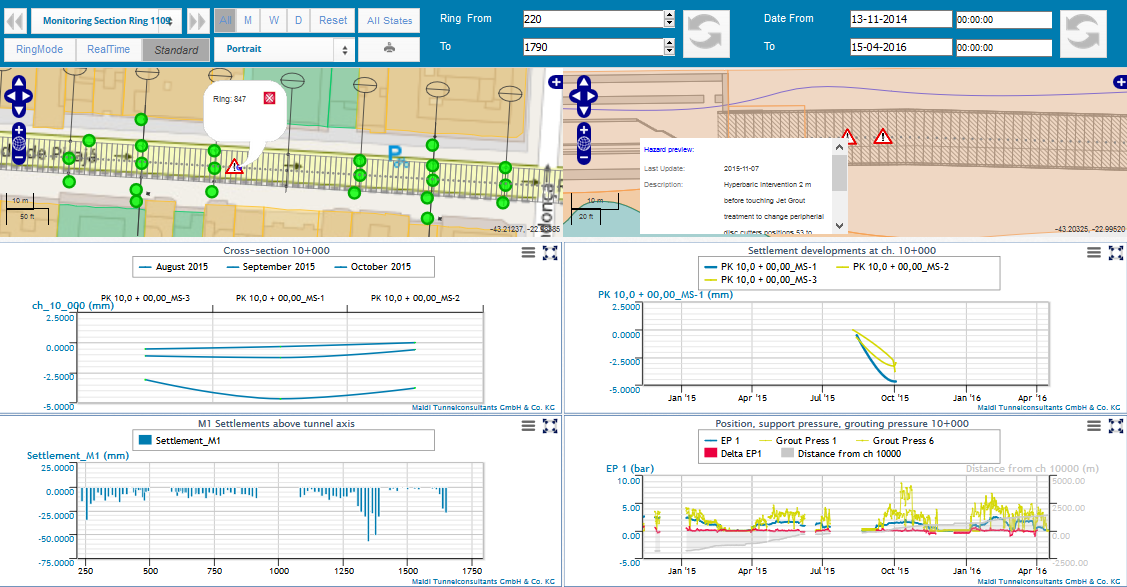
The monitoring data
module provides several features for displaying settlement data and other monitoring data in an interactive environment.
Some of these features are listed below:

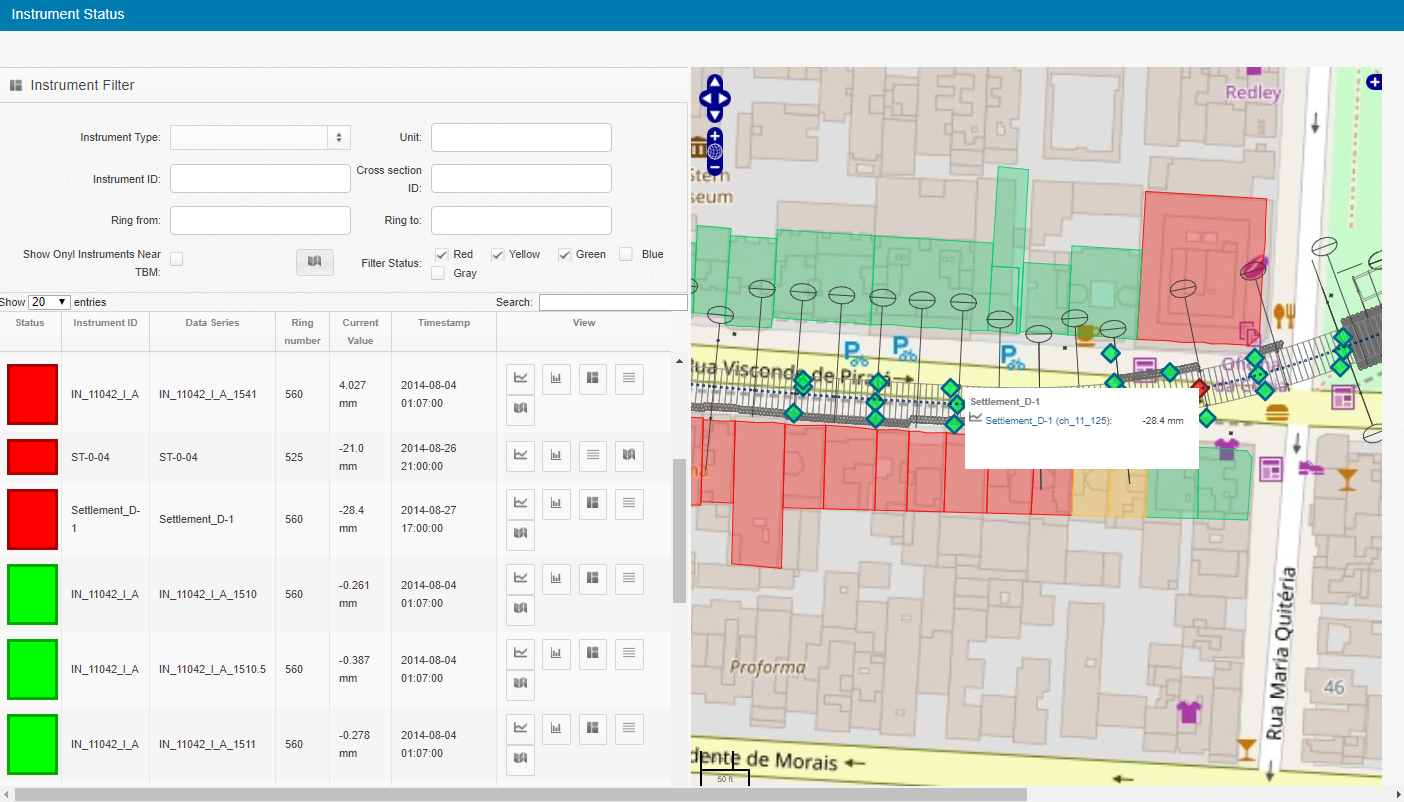
To monitor the status of the individual
instruments, PROCON provides a page where instruments are
listed in a table as well as shown on map. The table and map
are linked so that only those instruments listed in the table
are visible on the map. The content of the table can be
individually defined applying several filters like the
instrument type or the status of the instrument. Another
filter shows only those instrument in the table which are
located near the current position of the TBM in order to
rapidly list and access those instruments in the area of
influence of the tunnel excavation works. By default, the
instruments in the table are sorted by their status so that
the most critical instruments are always shown first.
For
monitoring an instrument more closely, several chart options
are provided for openening a standard chart, shield passing
chart or cross section chart. Additionally, data of the
corresponding instrument can be checked in a data table popup.
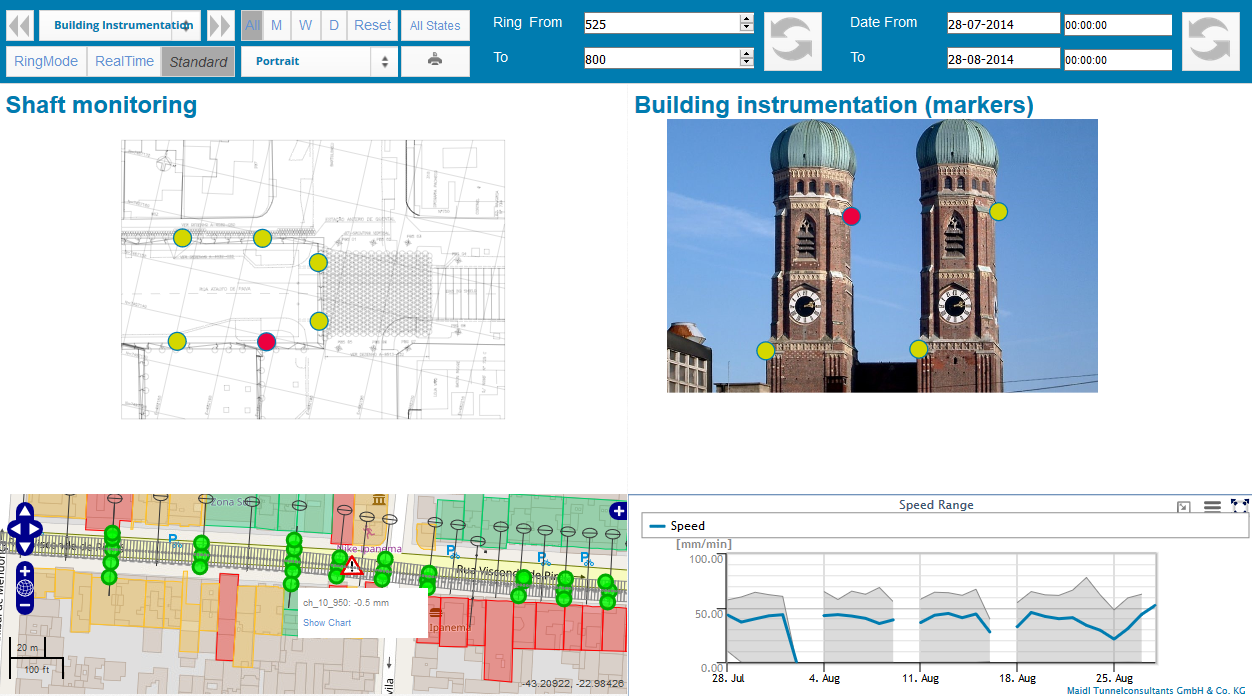
During a tunneling project some buildings are highly sensitive and have to be monitored very closely.
In PROCON for these building individual dashboards can be created which contain structural images where installed monitoring sensors
have been marked. By clicking on the marker, a chart pops up and displays the data of the sensor.
Thus, the user can very fast and easily inform himself about the status of corresponding building.
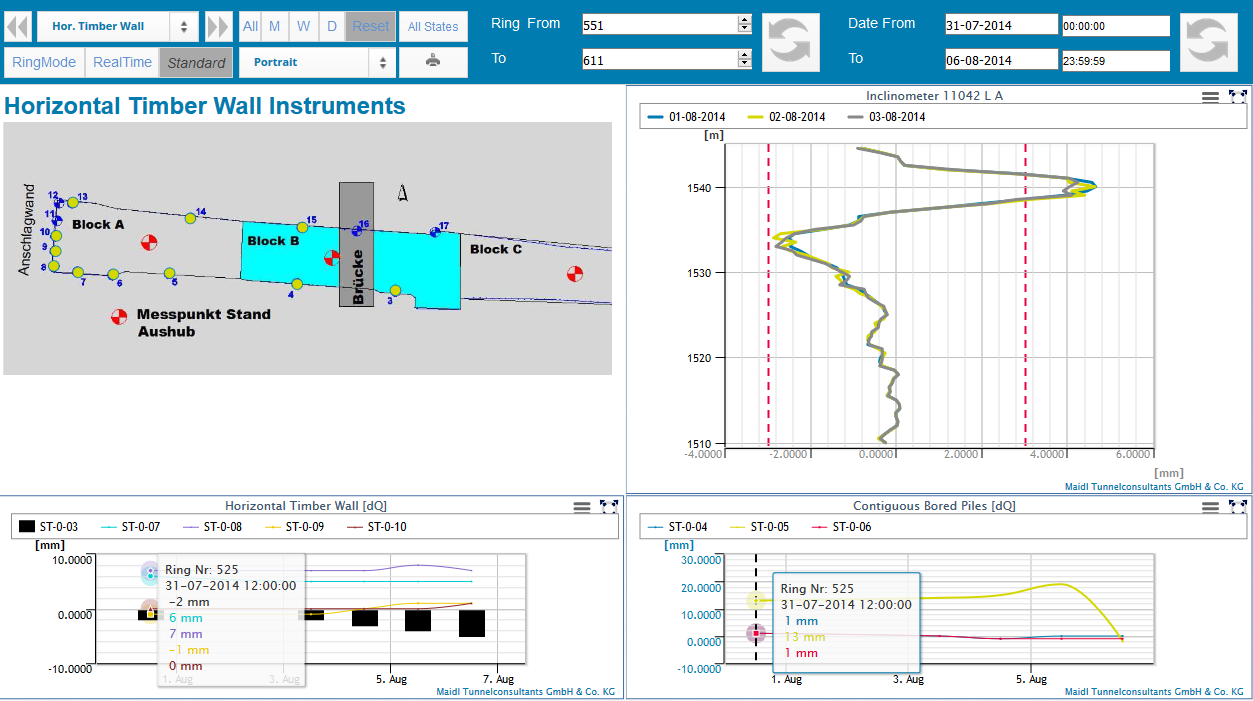
All aspects of a tunneling project can be captured with PROCON as well as the monitoring of the construction pit.
The arrangement of the individual sensors can be shown on a specific plot where each captured sensor can be clicked to show its sensor values in a chart.
Some corresponding charts of the monitored area can be arranged on the same dashboard to get a quick overview.