An interactive module for shift protocols extends the list of
optional features of PROCON. Extracting periods of advance, ring
building and standstill automatically from the machine data,
these time intervals are displayed using a Gantt chart
visualization for each shift.
Shift reporting represents
an essential element of the documentation of a tunneling project.
All actions are documented and can be evaluated as well as
exported. In Procon II, multiple types of shifts per day can be
generated like a morning, day and late shift. The key processes
like advance and ring build are automatically retrieved from the
machine data and assigned to each shift. The reason for each
downtime slot needs to be specified by the user. Here, the
catalog of downtimes is specified according to each project's
requirements. Based on the documented downtime reasons,
evaluations can be performed based on which the process can be
optimized.
For detail evaluations, additional filters on
specific shifts or staff members can be used, hence allowing for
an assessment of reasons for performance differences among the
shifts or to identify specific parameters that correlate with the
performance. The integrative nature of the data warehouse and the
unified temporal and spatial reference system helps identifying
previously unknown interactions and hidden mechanisms in the
process.
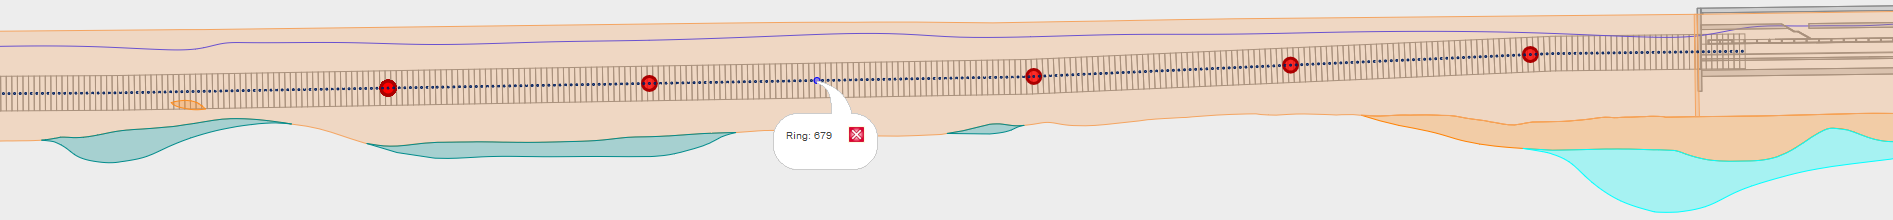
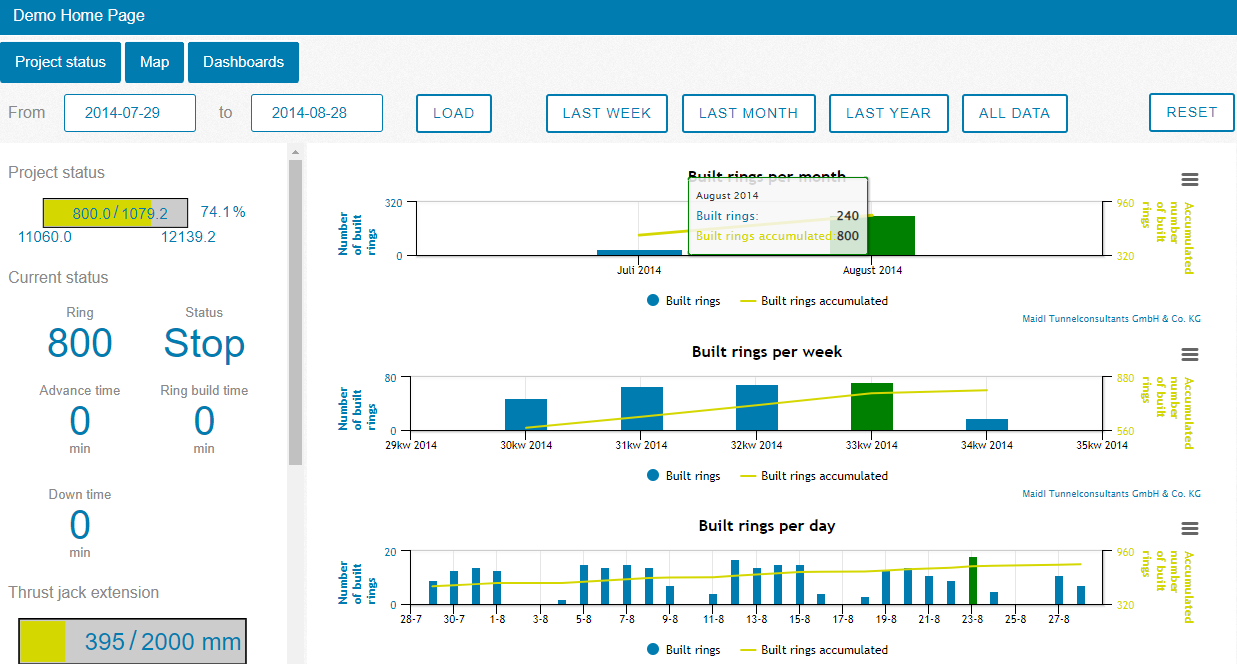
After logging in to PROCON, the start page of the project shows the user the current status of the project.
On top of the page, additional blue buttons lead to further content. On the one hand a map representation of the project and on the other hand a collection of dashboards with important content.
On the left side of the current status page, the project status is visualized based on the current chainage location of the machine.
Additionally, current project information like the current ring, status and production times are show.
Furthermore, information is provided on the number of built rings for the last shifts, day, week, month or year.
On the right side, 3 charts are provided visualizing the number of built rings of the projects for different time intervals.
By clicking on a column of an upper chart, the lower charts adapt their time range to the selected time interval.
The time interval can also be adapted by applying the buttons on top of the charts.

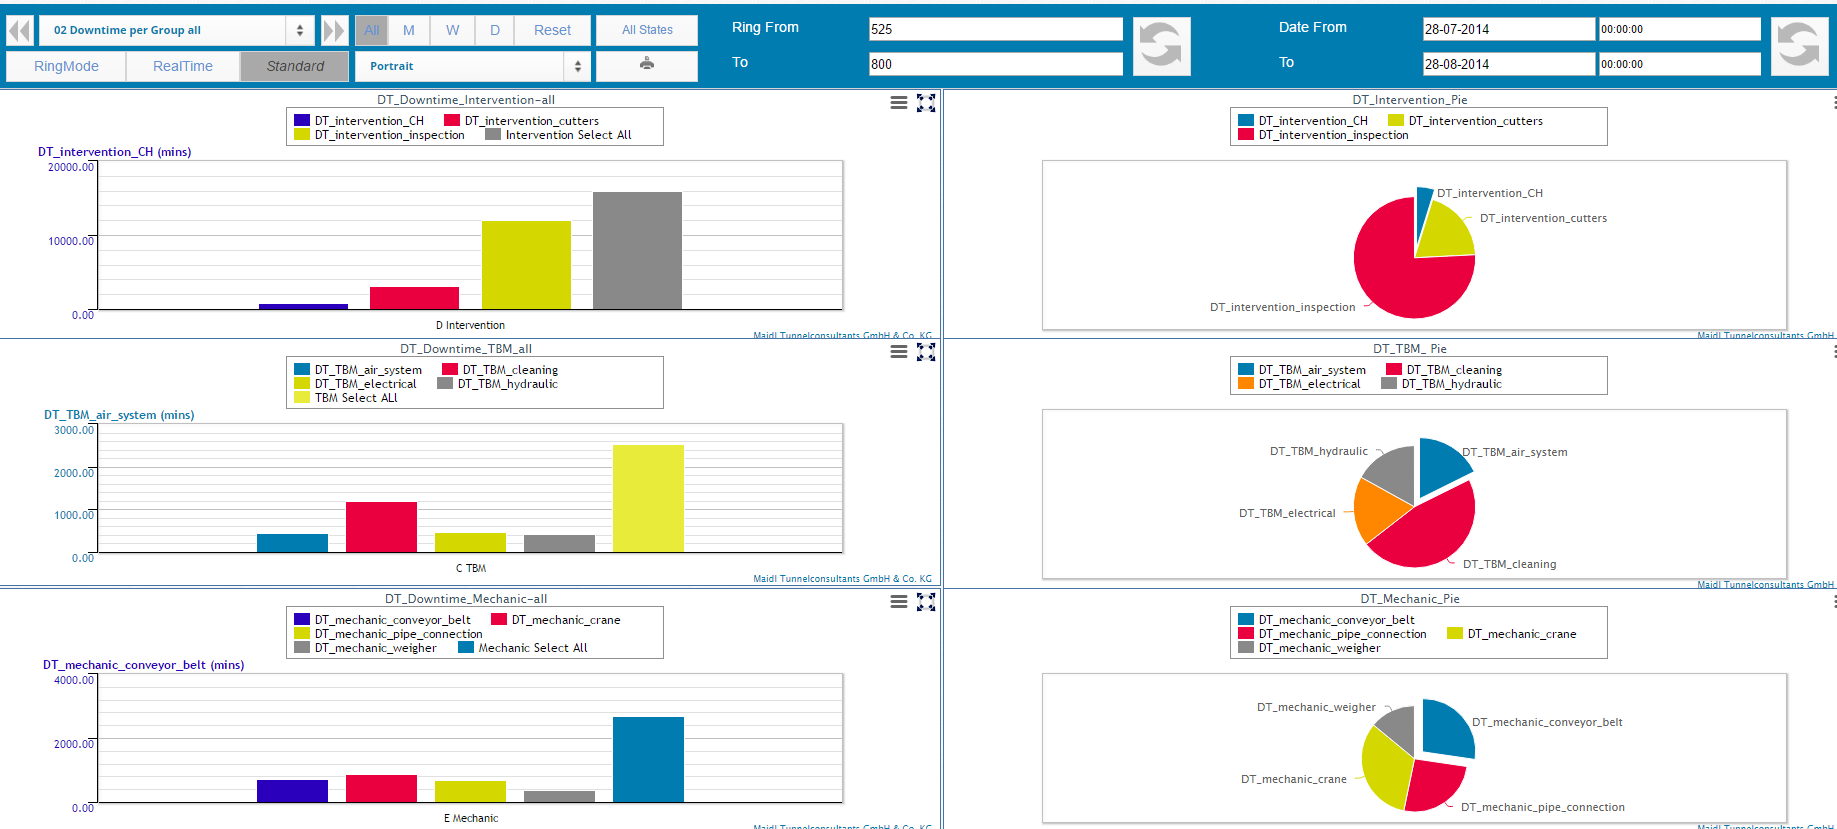
Evaluate the downtime distribution and analyze the reasons for
performance issues using different visualizations like pie charts
or bar charts. In those charts, either specific codes can be
captured or a whole group code. In this example, groups of codes
are selected.
The x-axis of the downtime bar charts can be
selected as required. For example, the downtimes can be evaluated
by ring, by day or by week.
Combining this information,
all processes in excavation can be analyzed regarding their time
and cost structure. Here, all information stored in PROCON can be
employed, like, e.g. geological information or machine data.
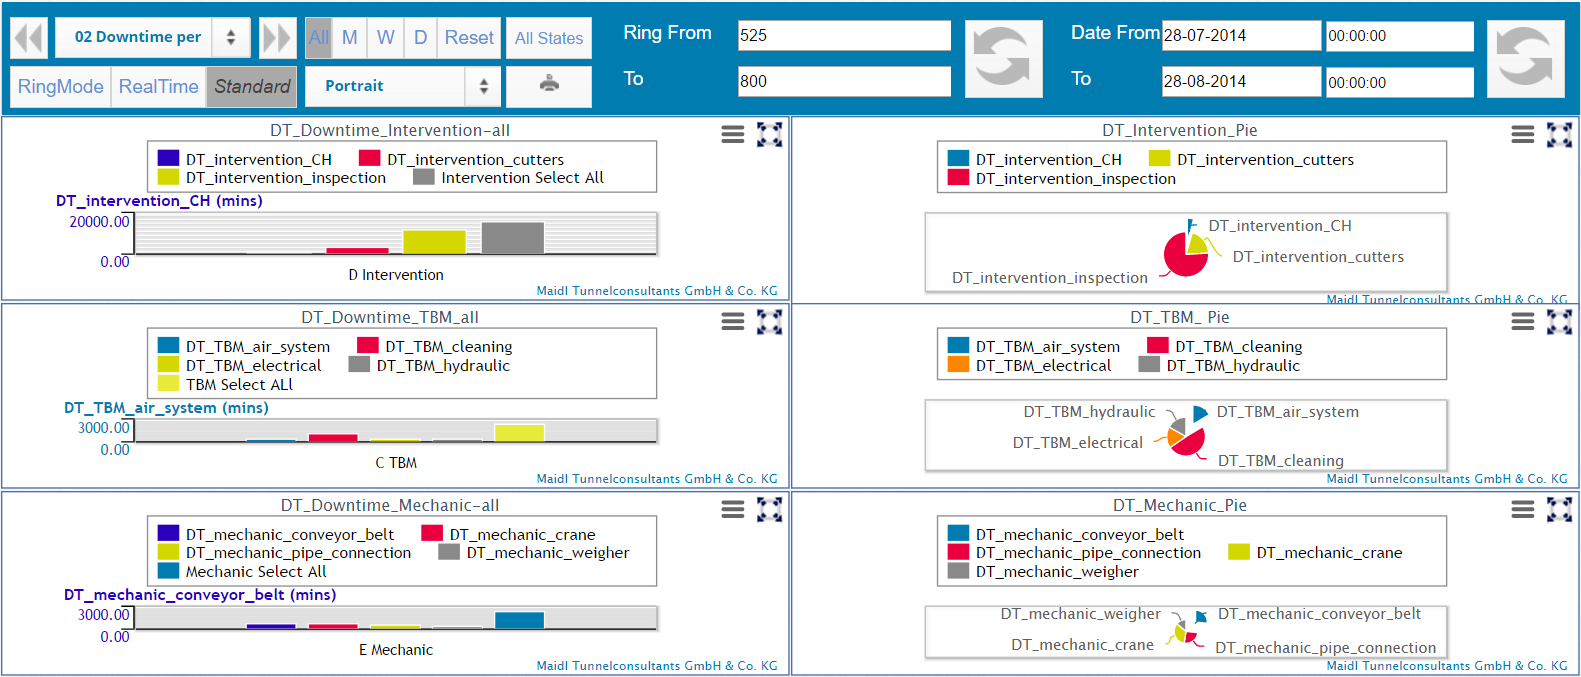
The downtime evalauation can also be
performed code-based. In this example the downtimes of an
individual downtime group are investigated based on different
chart types. On the x-axis of the bar chart a downtime group
is shown.
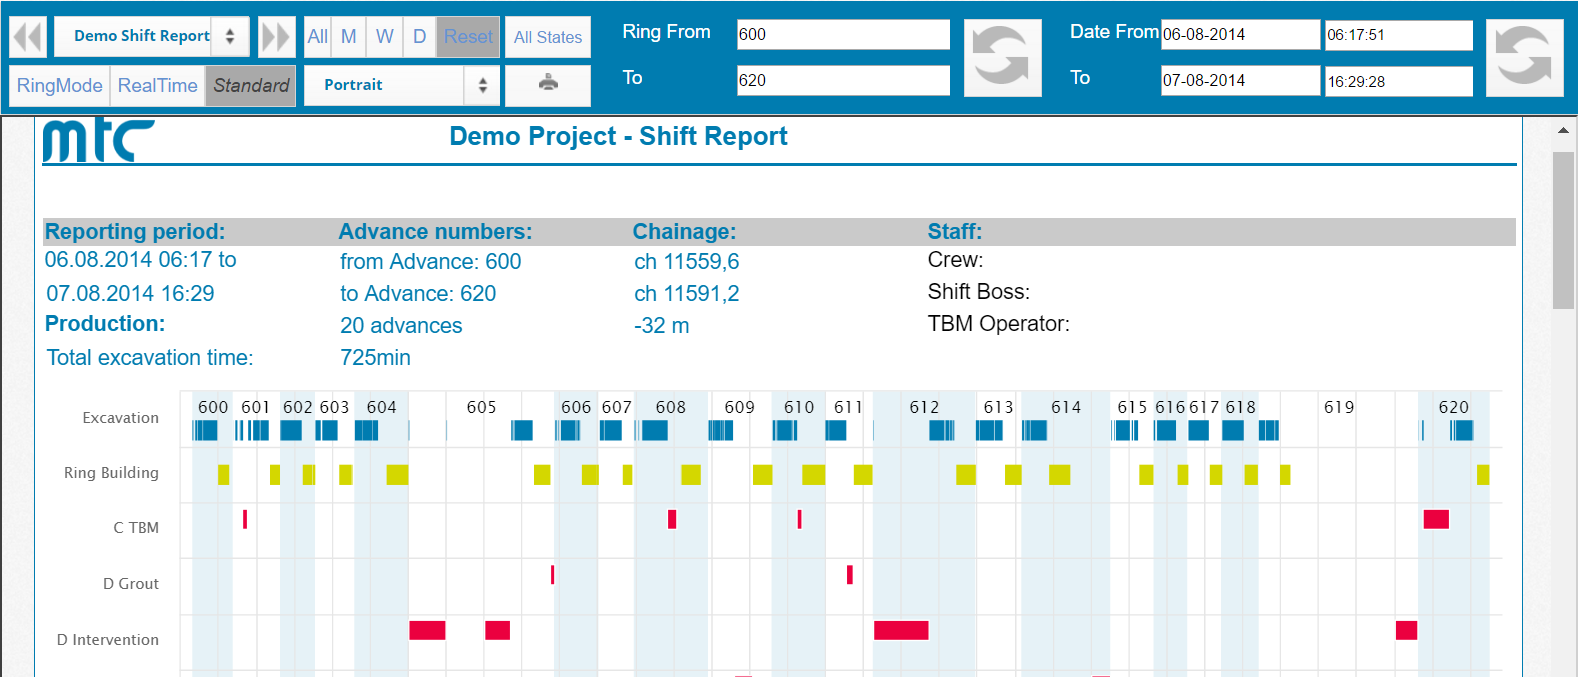
The presented shift report is a
customized report. It can be adapted specifically for your
needs.
In the report the individual downtimes are
visualized in a Gantt chart and listed in a table underneath.
Additionally, the main downtime reasons are provided.
The planned processes and downtime
durations can also be visualized in usual charts.
Additionally, other pages, e.g. of Procon, can be integrated
into a dashboard for operation. Here, the page for data input
is integrated into the dasboard so that you can easily enter
the specific downtime reasons in context of the overall
advance progress.
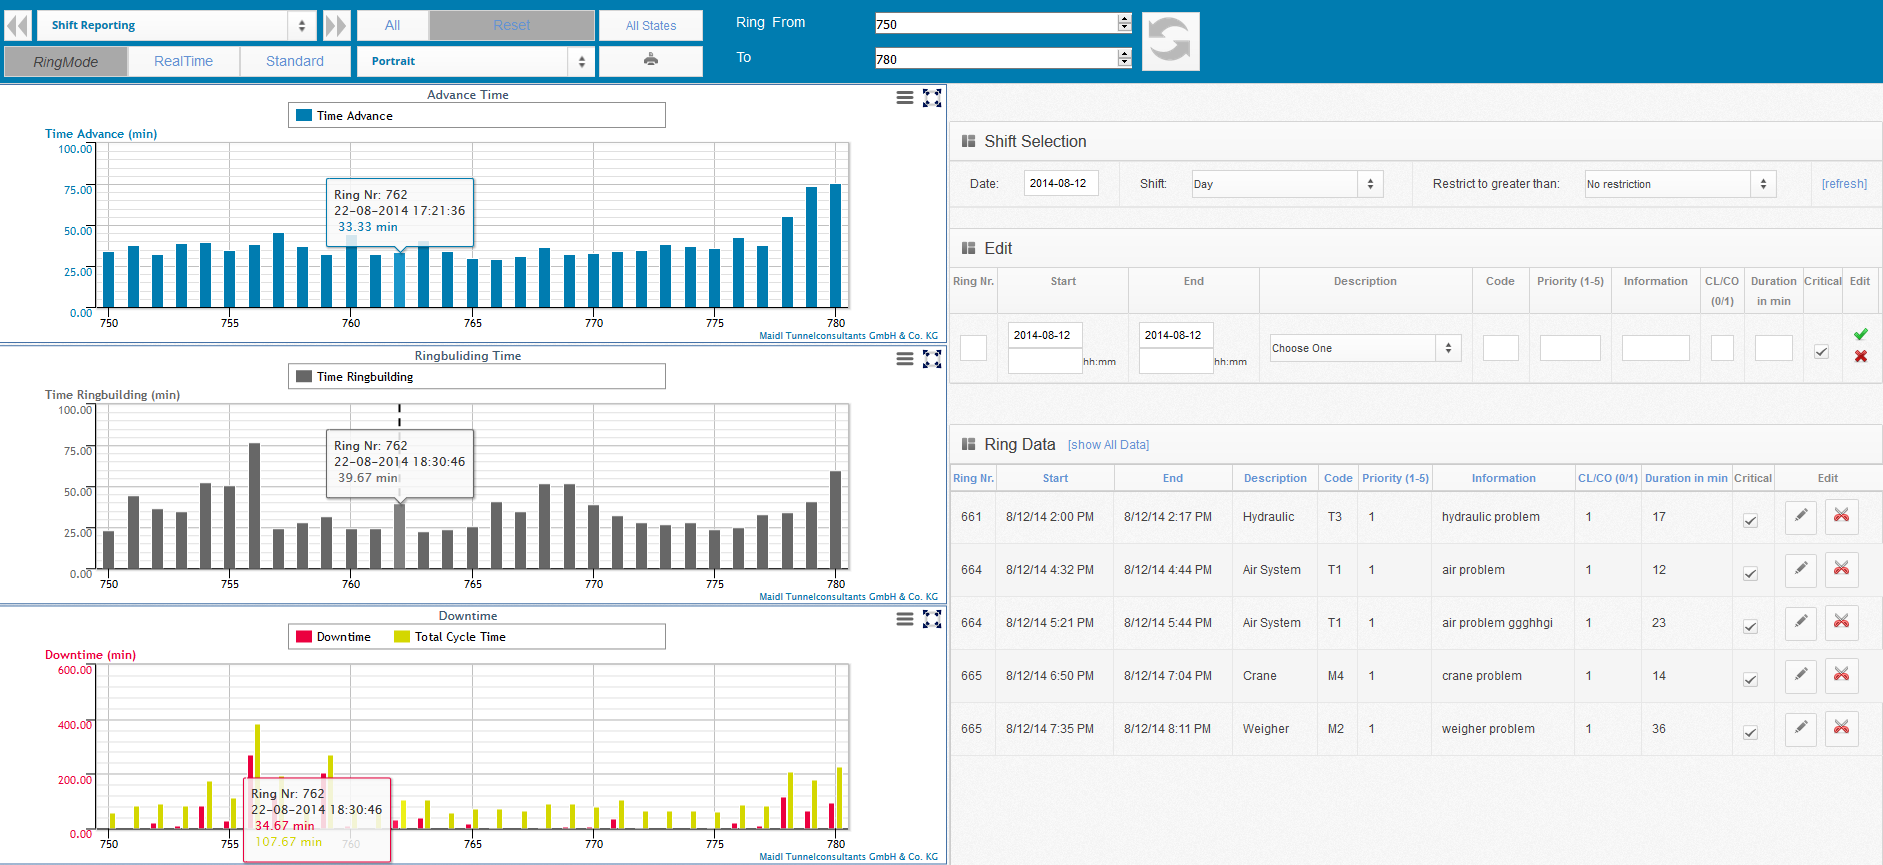
The individual downtimes for each shift
can be entered in a simple mask. A gantt chart on the top of
the page shows the main processes advance, ring build and
downtime along with already configured downtimes. The share of
each main process is shown in an adjacent pie chart. Each
process is assigned to a ring number that serves as location
reference and helps analyzing the downtimes for each ring
separately.
The entered downtimes can either be critical
or non-critical. Non-critical downtimes can overlap other
critical tasks whereas critical process and downtimes are not
allowed to overlap.
If required, those downtimes which
have not been assigned to a downtime category (e.g. because
they are too small), can be automatically be assigned to an
uncategorized downtime category to ensure that all downtimes
are captured. Additionally, many smaller downtimes can be
merged to one bigger one, if this is required to document the
shift.
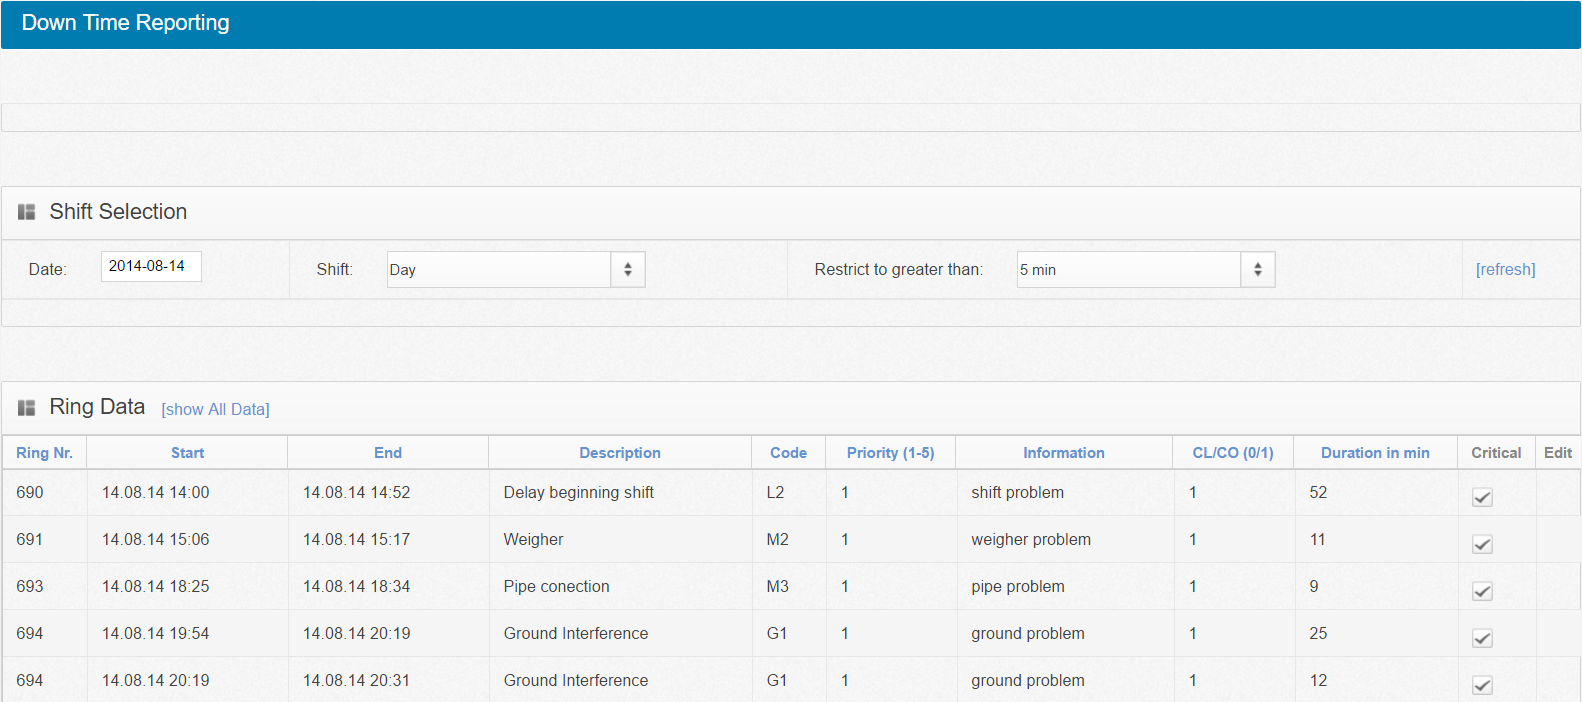
Important: To see
entered downtime on the demo page, please select either a ring
(range: 525 - 800) or a date in the "Shift Selection" (range:
27.07.2014 - 27.08.2014), a shift type and, optionally, a time
restriction. Next, click on the "refresh" link on the right.